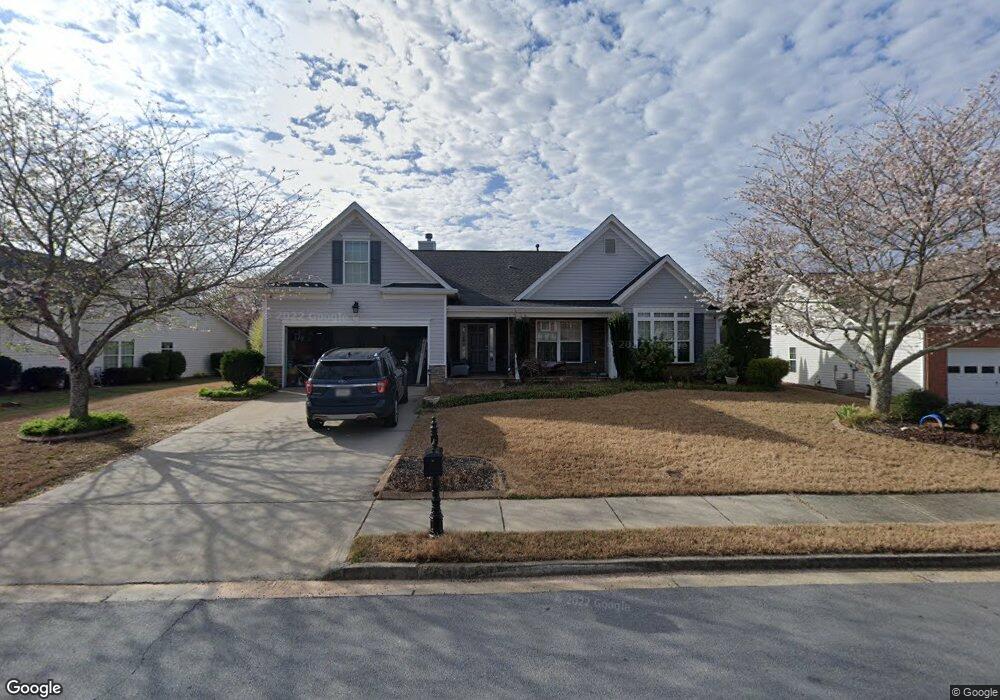
2603 Carleton Gold Rd Unit 6A Dacula, GA 30019
Estimated Value: $406,000 - $428,000
3
Beds
2
Baths
2,802
Sq Ft
$149/Sq Ft
Est. Value
About This Home
This home is located at 2603 Carleton Gold Rd Unit 6A, Dacula, GA 30019 and is currently estimated at $417,642, approximately $149 per square foot. 2603 Carleton Gold Rd Unit 6A is a home located in Gwinnett County with nearby schools including Dacula Elementary School, Dacula Middle School, and Dacula High School.
Ownership History
Date
Name
Owned For
Owner Type
Purchase Details
Closed on
Oct 29, 2019
Sold by
Ferguson Bert V
Bought by
Ferguson Bert and Bert & Miriam Ferguson Tr
Current Estimated Value
Purchase Details
Closed on
Mar 22, 2013
Sold by
Ferguson Miriam
Bought by
Ferguson Miriam and Ferguson Bert
Home Financials for this Owner
Home Financials are based on the most recent Mortgage that was taken out on this home.
Original Mortgage
$116,250
Interest Rate
3.57%
Mortgage Type
New Conventional
Purchase Details
Closed on
Jul 11, 2012
Sold by
Cumberbatch Jean
Bought by
Ferguson Miriam
Purchase Details
Closed on
Jul 25, 2006
Sold by
Arlington Builders Llc
Bought by
Cumberbatch Jean
Home Financials for this Owner
Home Financials are based on the most recent Mortgage that was taken out on this home.
Original Mortgage
$174,402
Interest Rate
6.68%
Mortgage Type
New Conventional
Create a Home Valuation Report for This Property
The Home Valuation Report is an in-depth analysis detailing your home's value as well as a comparison with similar homes in the area
Home Values in the Area
Average Home Value in this Area
Purchase History
| Date | Buyer | Sale Price | Title Company |
|---|---|---|---|
| Ferguson Bert | -- | -- | |
| Ferguson Miriam | -- | -- | |
| Ferguson Miriam | -- | -- | |
| Cumberbatch Jean | $218,100 | -- |
Source: Public Records
Mortgage History
| Date | Status | Borrower | Loan Amount |
|---|---|---|---|
| Previous Owner | Ferguson Miriam | $116,250 | |
| Previous Owner | Cumberbatch Jean | $174,402 |
Source: Public Records
Tax History
| Year | Tax Paid | Tax Assessment Tax Assessment Total Assessment is a certain percentage of the fair market value that is determined by local assessors to be the total taxable value of land and additions on the property. | Land | Improvement |
|---|---|---|---|---|
| 2025 | $7,043 | $189,240 | $30,000 | $159,240 |
| 2024 | $6,382 | $168,360 | $32,000 | $136,360 |
| 2023 | $6,382 | $157,680 | $26,000 | $131,680 |
| 2022 | $5,972 | $157,680 | $26,000 | $131,680 |
| 2021 | $4,568 | $116,320 | $20,800 | $95,520 |
| 2020 | $4,256 | $107,000 | $20,800 | $86,200 |
| 2019 | $3,945 | $102,560 | $19,200 | $83,360 |
| 2018 | $3,494 | $89,600 | $16,800 | $72,800 |
| 2016 | $3,110 | $78,160 | $14,000 | $64,160 |
| 2015 | $2,945 | $72,560 | $12,000 | $60,560 |
| 2014 | $2,857 | $69,680 | $12,000 | $57,680 |
Source: Public Records
Map
Nearby Homes
- 67 Creek Side Place
- 2579 Wimberley Pine Ct
- 306 Reliance Way
- 2451 Merrion Park Ct
- 2787 Riders Ct
- 745 Roland Manor Dr Unit 1
- 275 Roland Manor Dr
- 2015 Waycross Ln
- 2407 Pelham Pass
- 2237 Pelham Pass
- 2085 Waycross Ln
- 2304 Pelham Pass
- 682 Secret Garden Ln Unit 61A
- 682 Secret Garden Ln
- 1950 Van Allen Ct
- 2671 Freemans Walk Path
- 3472 Fishpond Cir
- 1248 Austin Thomas Dr
- 3507 Fishpond Cir
- 3392 Shank Grove
- 2613 Carleton Gold Rd
- 2593 Carleton Gold Rd
- 2672 Colleen Ln
- 2682 Colleen Ln Unit 6B
- 2583 Carleton Gold Rd
- 2662 Colleen Ln
- 2592 Carleton Gold Rd
- 2592 Carleton Gold Rd Unit 176
- 750 Ralph Still Rd Unit 45
- 750 Ralph Still Rd
- 770 Ralph Still Rd
- 770 Ralph Still Rd Unit 47
- 753 Ralph Still Rd Unit 49
- 753 Ralph Still Rd
- 753 Ralph Still Rd Unit 56
- 771 Ralph Still Rd Unit 48
- 771 Ralph Still Rd
- 744 Ralph Still Rd
- 725 Ralph Still Rd
- 744 Ralph Still Rd Unit 44
Your Personal Tour Guide
Ask me questions while you tour the home.