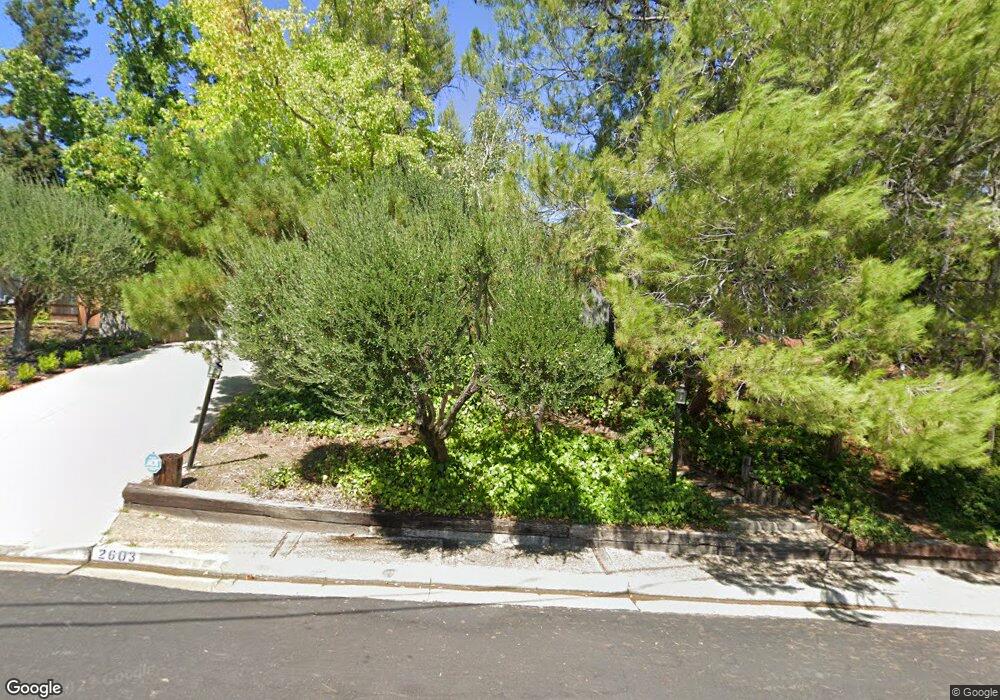
2603 Pebble Beach Loop Lafayette, CA 94549
Estimated Value: $1,155,572 - $1,565,000
4
Beds
2
Baths
1,996
Sq Ft
$700/Sq Ft
Est. Value
About This Home
This home is located at 2603 Pebble Beach Loop, Lafayette, CA 94549 and is currently estimated at $1,397,643, approximately $700 per square foot. 2603 Pebble Beach Loop is a home located in Contra Costa County with nearby schools including John Swett Elementary School, Martinez Junior High School, and Alhambra Senior High School.
Ownership History
Date
Name
Owned For
Owner Type
Purchase Details
Closed on
Sep 19, 2023
Sold by
Moriarty Ann Benton
Bought by
Ann Moriarty 2023 Revocable Trust and Moriarty
Current Estimated Value
Purchase Details
Closed on
Feb 22, 2013
Sold by
Moriarty Ann Benton and Moriarty A
Bought by
Moriarty Ann Benton
Home Financials for this Owner
Home Financials are based on the most recent Mortgage that was taken out on this home.
Original Mortgage
$324,000
Interest Rate
3.34%
Mortgage Type
New Conventional
Purchase Details
Closed on
Jun 29, 1999
Sold by
Benton Ann R and Benton A R
Bought by
Moriarty A R
Home Financials for this Owner
Home Financials are based on the most recent Mortgage that was taken out on this home.
Original Mortgage
$200,000
Interest Rate
7%
Mortgage Type
Purchase Money Mortgage
Create a Home Valuation Report for This Property
The Home Valuation Report is an in-depth analysis detailing your home's value as well as a comparison with similar homes in the area
Purchase History
| Date | Buyer | Sale Price | Title Company |
|---|---|---|---|
| Ann Moriarty 2023 Revocable Trust | -- | None Listed On Document | |
| Moriarty Ann Benton | -- | First American Title Company | |
| Moriarty A R | -- | North American Title Co |
Source: Public Records
Mortgage History
| Date | Status | Borrower | Loan Amount |
|---|---|---|---|
| Previous Owner | Moriarty Ann Benton | $324,000 | |
| Previous Owner | Moriarty A R | $200,000 |
Source: Public Records
Tax History
| Year | Tax Paid | Tax Assessment Tax Assessment Total Assessment is a certain percentage of the fair market value that is determined by local assessors to be the total taxable value of land and additions on the property. | Land | Improvement |
|---|---|---|---|---|
| 2025 | $3,008 | $190,221 | $35,015 | $155,206 |
| 2024 | $2,897 | $186,492 | $34,329 | $152,163 |
| 2023 | $2,897 | $182,836 | $33,656 | $149,180 |
| 2022 | $2,854 | $179,252 | $32,997 | $146,255 |
| 2021 | $2,786 | $175,738 | $32,350 | $143,388 |
| 2019 | $2,691 | $170,528 | $31,392 | $139,136 |
| 2018 | $2,560 | $167,185 | $30,777 | $136,408 |
| 2017 | $2,503 | $163,908 | $30,174 | $133,734 |
| 2016 | $2,332 | $160,695 | $29,583 | $131,112 |
| 2015 | $2,291 | $158,282 | $29,139 | $129,143 |
| 2014 | $2,238 | $155,183 | $28,569 | $126,614 |
Source: Public Records
Map
Nearby Homes
- 657 Byrdee Way
- 407 Roanoke Dr
- 222 Donegal Way
- 203 Virginia Cir
- 61 Banbridge Place
- 966 Oak Vista Ct
- 241 Blue Ridge Dr
- 1239 Sunrise Ridge Dr
- 120 Arbor View Ln
- 11 Paddock Ct
- 137 Haslemere Ct
- 12 Paddock Ct
- 10 Pomfret Walk Unit 11
- 120 Haslemere Ct
- 3284 Surmont Dr
- 726 Grayson Rd
- 834 Carter Acres Ln
- 14 Heritage Oaks Rd
- 160 Southwind Dr
- 1903 Via Ferrari
- 2597 Pebble Beach Loop
- 1084 Country Club Dr
- 2473 Pebble Beach Loop
- 2589 Pebble Beach Loop
- 2485 Pebble Beach Loop
- 2608 Pebble Beach Loop
- 2596 Pebble Beach Loop
- 2472 Pebble Beach Loop
- 2466 Pebble Beach Loop
- 2583 Pebble Beach Loop
- 2590 Pebble Beach Loop
- 2478 Pebble Beach Loop
- 1091 Country Club Dr
- 2459 Cherry Hills Dr
- 5 Smoketree Ct
- 1 Smoketree Ct
- 1099 Country Club Dr
- 2486 Pebble Beach Loop
- 2460 Cherry Hills Dr
- 2584 Pebble Beach Loop
Your Personal Tour Guide
Ask me questions while you tour the home.