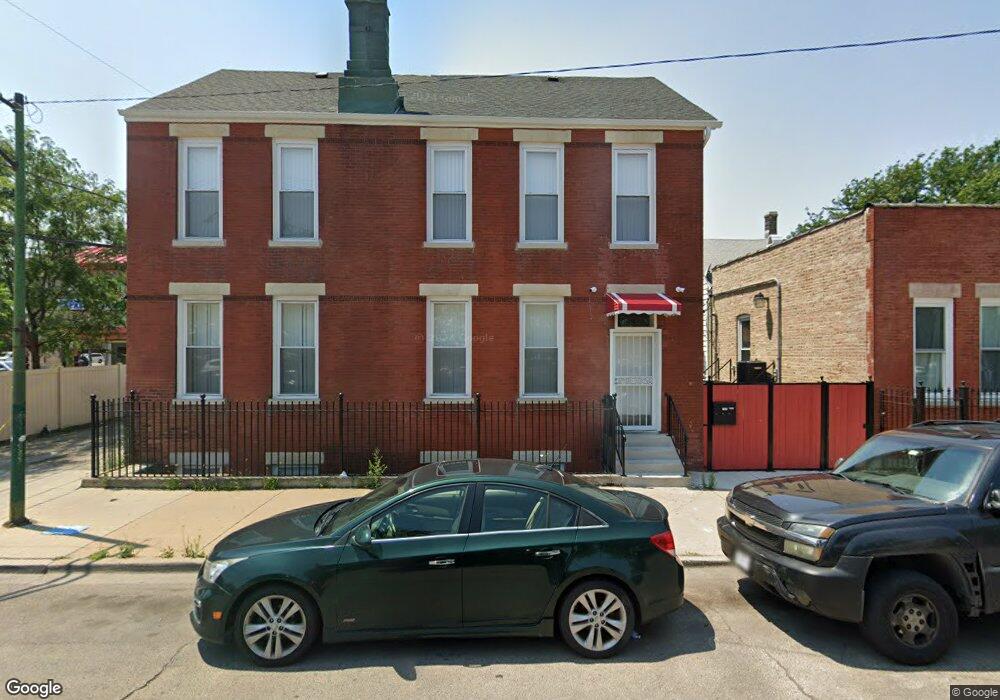
2603 W 21st Place Chicago, IL 60608
Little Village NeighborhoodEstimated Value: $242,456 - $503,000
3
Beds
1
Bath
1,302
Sq Ft
$278/Sq Ft
Est. Value
About This Home
This home is located at 2603 W 21st Place, Chicago, IL 60608 and is currently estimated at $361,364, approximately $277 per square foot. 2603 W 21st Place is a home located in Cook County with nearby schools including Hammond Elementary School, Acero - Octavio Paz Elementary School, and Latino Youth High School.
Ownership History
Date
Name
Owned For
Owner Type
Purchase Details
Closed on
Oct 4, 2016
Sold by
Pena Adolfo
Bought by
Pena Adolfo and Pena Graciela
Current Estimated Value
Home Financials for this Owner
Home Financials are based on the most recent Mortgage that was taken out on this home.
Original Mortgage
$154,805
Outstanding Balance
$128,919
Interest Rate
4.75%
Mortgage Type
New Conventional
Estimated Equity
$232,445
Purchase Details
Closed on
Oct 17, 2008
Sold by
Pena Adolfo and Pena Graciela
Bought by
Pena Adolfo and Adolfo Pena Trust
Purchase Details
Closed on
May 17, 2001
Sold by
Monrroy Mario and Monrroy Martha
Bought by
Pena Adolfo and Pena Graciela
Purchase Details
Closed on
Aug 11, 2000
Sold by
Pacyk Terese
Bought by
Monrroy Mario and Monrroy Martha
Home Financials for this Owner
Home Financials are based on the most recent Mortgage that was taken out on this home.
Original Mortgage
$96,000
Interest Rate
8.16%
Create a Home Valuation Report for This Property
The Home Valuation Report is an in-depth analysis detailing your home's value as well as a comparison with similar homes in the area
Home Values in the Area
Average Home Value in this Area
Purchase History
| Date | Buyer | Sale Price | Title Company |
|---|---|---|---|
| Pena Adolfo | -- | Greater Illinois Title | |
| Pena Adolfo | -- | None Available | |
| Pena Adolfo | $70,000 | -- | |
| Monrroy Mario | $120,000 | Ticor Title Insurance |
Source: Public Records
Mortgage History
| Date | Status | Borrower | Loan Amount |
|---|---|---|---|
| Open | Pena Adolfo | $154,805 | |
| Previous Owner | Monrroy Mario | $96,000 |
Source: Public Records
Tax History Compared to Growth
Tax History
| Year | Tax Paid | Tax Assessment Tax Assessment Total Assessment is a certain percentage of the fair market value that is determined by local assessors to be the total taxable value of land and additions on the property. | Land | Improvement |
|---|---|---|---|---|
| 2024 | $1,582 | $21,119 | $4,385 | $16,734 |
| 2023 | $1,542 | $7,500 | $3,553 | $3,947 |
| 2022 | $1,542 | $7,500 | $3,553 | $3,947 |
| 2021 | $1,508 | $7,499 | $3,553 | $3,946 |
| 2020 | $2,654 | $11,913 | $3,553 | $8,360 |
| 2019 | $2,720 | $13,538 | $3,553 | $9,985 |
| 2018 | $2,792 | $14,134 | $3,553 | $10,581 |
| 2017 | $2,422 | $11,250 | $3,175 | $8,075 |
| 2016 | $2,253 | $11,250 | $3,175 | $8,075 |
| 2015 | $2,062 | $11,250 | $3,175 | $8,075 |
| 2014 | $2,162 | $11,652 | $3,024 | $8,628 |
| 2013 | $2,119 | $11,652 | $3,024 | $8,628 |
Source: Public Records
Map
Nearby Homes
- 2613 W 21st St
- 2649 W 21st Place
- 2653 W 21st St
- 2135 S Fairfield Ave
- 2604 W 23rd Place
- 2236 W 23rd Place
- 2633 W 23rd Place
- 2732 W 23rd Place
- 2824 W Cermak Rd
- 2702 W 24th St
- 2335 W 21st St
- 2334 W 21st St
- 2835 W Cullerton St
- 2658 W 24th Place
- 2315 W 21st St
- 2655 W 24th Place
- 2328 W 19th St
- 2701 W 24th Place
- 2213 S Oakley Ave
- 2338 W 18th Place
- 2603 W 21st Place Unit 1
- 2607 W 21st Place
- 2601 W 21st Place
- 2601 W 21st Place Unit 2F
- 2601 W 21st Place Unit GARDEN
- 2601 W 21st Place Unit 1R
- 2601 W 21st Place Unit 1F
- 2601 W 21st Place Unit REAR
- 2601 W 21st Place Unit FRONT
- 2609 W 21st Place
- 2611 W 21st Place
- 2613 W 21st Place
- 2615 W 21st Place
- 2619 W 21st Place
- 2600 W Cermak Rd
- 2621 W 21st Place
- 2623 W 21st Place
- 2623 W 21st Place Unit 1
- 2623 W 21st Place Unit 2