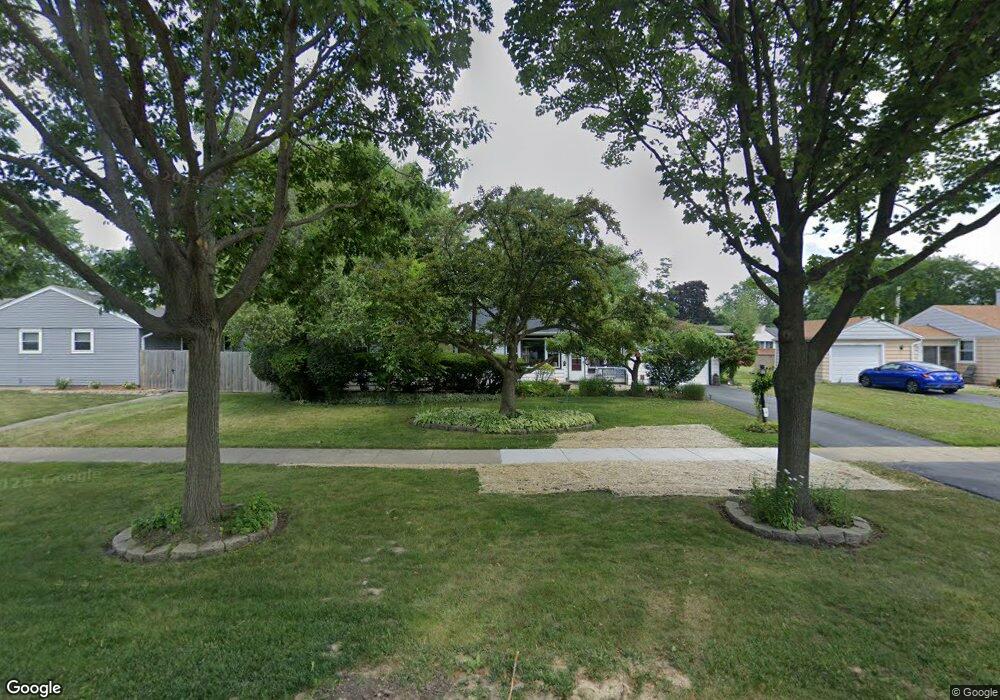
2604 Campbell St Rolling Meadows, IL 60008
Estimated Value: $360,000 - $430,000
3
Beds
2
Baths
1,783
Sq Ft
$223/Sq Ft
Est. Value
About This Home
This home is located at 2604 Campbell St, Rolling Meadows, IL 60008 and is currently estimated at $397,178, approximately $222 per square foot. 2604 Campbell St is a home located in Cook County with nearby schools including Kimball Hill Elementary School, Carl Sandburg Junior High School, and Rolling Meadows High School.
Ownership History
Date
Name
Owned For
Owner Type
Purchase Details
Closed on
Jul 18, 2007
Sold by
Abt Donna R and Abt Karl W
Bought by
Stoychev Rumen and Stoycheva Dochka
Current Estimated Value
Home Financials for this Owner
Home Financials are based on the most recent Mortgage that was taken out on this home.
Original Mortgage
$225,200
Interest Rate
6.63%
Mortgage Type
Unknown
Purchase Details
Closed on
Oct 24, 1995
Sold by
Abt Karl W and Abt Donna R
Bought by
Abt Donna R and Abt Karl W
Purchase Details
Closed on
Jul 18, 1994
Sold by
Monson Timothy A and Monson Carolyn S
Bought by
Abt Karl W and Abt Donna R
Create a Home Valuation Report for This Property
The Home Valuation Report is an in-depth analysis detailing your home's value as well as a comparison with similar homes in the area
Home Values in the Area
Average Home Value in this Area
Purchase History
| Date | Buyer | Sale Price | Title Company |
|---|---|---|---|
| Stoychev Rumen | $281,500 | None Available | |
| Abt Donna R | -- | -- | |
| Abt Karl W | $160,000 | Attorneys Title Guaranty Fun |
Source: Public Records
Mortgage History
| Date | Status | Borrower | Loan Amount |
|---|---|---|---|
| Previous Owner | Stoychev Rumen | $225,200 |
Source: Public Records
Tax History
| Year | Tax Paid | Tax Assessment Tax Assessment Total Assessment is a certain percentage of the fair market value that is determined by local assessors to be the total taxable value of land and additions on the property. | Land | Improvement |
|---|---|---|---|---|
| 2025 | $7,872 | $34,000 | $6,513 | $27,487 |
| 2024 | $7,872 | $29,000 | $5,511 | $23,489 |
| 2023 | $7,508 | $29,000 | $5,511 | $23,489 |
| 2022 | $7,508 | $29,000 | $5,511 | $23,489 |
| 2021 | $5,455 | $19,802 | $3,256 | $16,546 |
| 2020 | $5,400 | $19,802 | $3,256 | $16,546 |
| 2019 | $5,738 | $23,152 | $3,256 | $19,896 |
| 2018 | $6,728 | $24,206 | $3,006 | $21,200 |
| 2017 | $6,610 | $24,206 | $3,006 | $21,200 |
| 2016 | $6,880 | $25,772 | $3,006 | $22,766 |
| 2015 | $6,005 | $21,697 | $2,755 | $18,942 |
| 2014 | $5,879 | $21,697 | $2,755 | $18,942 |
| 2013 | $5,720 | $21,697 | $2,755 | $18,942 |
Source: Public Records
Map
Nearby Homes
- 2503 George St
- 2308 Park St
- 2814 Cardinal Dr
- 3100 Town Square Dr Unit 308
- 2709 Lily Ln
- 1605 W Fremont St
- 1419 W Miner St
- 3135 Town Square Dr Unit 401
- 3135 Town Square Dr Unit 407
- 3135 Town Square Dr Unit 104
- 2302 Flicker Ln
- 3265 Kirchoff Rd Unit 116
- 1505 W Euclid Ave
- 2201 Kingfisher Ln
- 2401 Rohlwing Rd
- 3200 Thrush Ln
- 3800 Ashley Ct
- 3806 Ashley Ct
- 3101 Thrush Ln
- 3107 Falcon Ct W
- 2602 Campbell St
- 2500 Bluebird Ln
- 2412 Bluebird Ln
- 3002 Rolling Meadow L2
- 18 Rolling Meadow L3
- 45 Rolling Meadow L4
- 118 Rolling Meadow L5
- 20 Rolling Meadow L6
- 3301 Rolling Meadow L 8
- 2507 Meadow Dr
- 2410 Bluebird Ln
- 2509 Meadow Dr
- 2505 Meadow Dr
- 2408 Bluebird Ln
- 2501 Bluebird Ln
- 2503 Meadow Dr
- 2605 Campbell St
- 2601 Campbell St
- 2603 Campbell St
- 2607 Campbell St
Your Personal Tour Guide
Ask me questions while you tour the home.