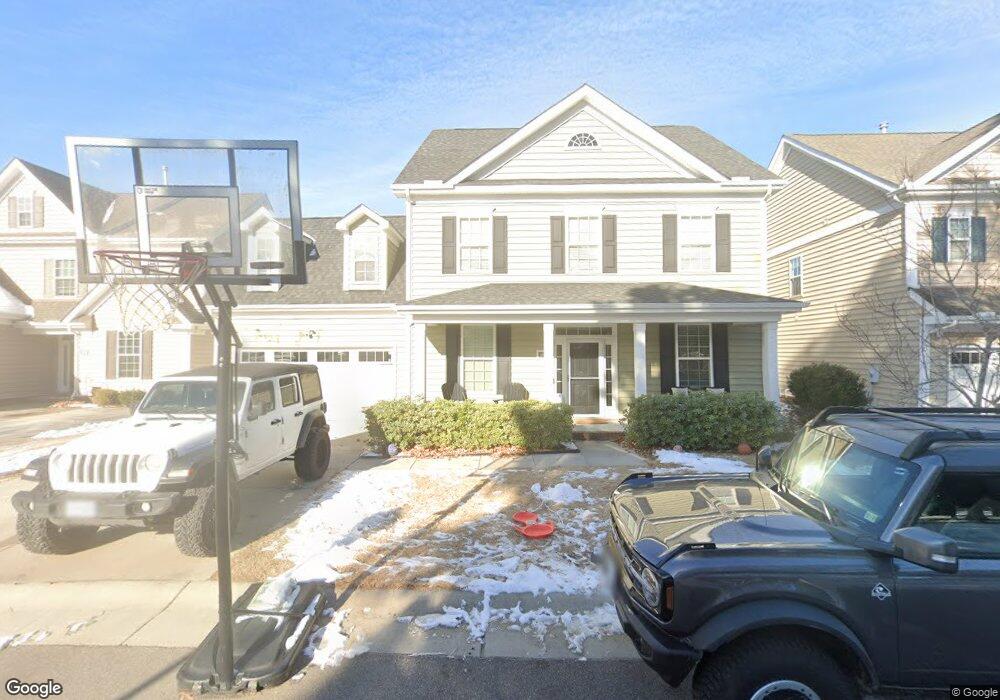
2604 Magnolia Green Loop Unit 13 Virginia Beach, VA 23456
Dam Neck NeighborhoodEstimated Value: $571,765 - $599,000
4
Beds
2
Baths
2,380
Sq Ft
$245/Sq Ft
Est. Value
About This Home
This home is located at 2604 Magnolia Green Loop Unit 13, Virginia Beach, VA 23456 and is currently estimated at $582,941, approximately $244 per square foot. 2604 Magnolia Green Loop Unit 13 is a home located in Virginia Beach City with nearby schools including North Landing Elementary School, Landstown Middle School, and Floyd E. Kellam High School.
Ownership History
Date
Name
Owned For
Owner Type
Purchase Details
Closed on
Oct 3, 2025
Sold by
Dominic Chad E and Dominic Jamie N
Bought by
Anto Litto and Litto Bincy
Current Estimated Value
Home Financials for this Owner
Home Financials are based on the most recent Mortgage that was taken out on this home.
Original Mortgage
$464,000
Outstanding Balance
$463,581
Interest Rate
6.5%
Mortgage Type
New Conventional
Estimated Equity
$119,360
Purchase Details
Closed on
Nov 15, 2021
Sold by
Dominic Jamb N and Dominic Chad E
Bought by
Dominic Jamb N and Dominic Chad E
Home Financials for this Owner
Home Financials are based on the most recent Mortgage that was taken out on this home.
Original Mortgage
$315,500
Interest Rate
3.05%
Mortgage Type
New Conventional
Purchase Details
Closed on
Sep 4, 2020
Sold by
Dominic Jamie N and Stewart Jamie N
Bought by
Dominic Jamie N
Home Financials for this Owner
Home Financials are based on the most recent Mortgage that was taken out on this home.
Original Mortgage
$316,000
Interest Rate
2.8%
Mortgage Type
New Conventional
Create a Home Valuation Report for This Property
The Home Valuation Report is an in-depth analysis detailing your home's value as well as a comparison with similar homes in the area
Home Values in the Area
Average Home Value in this Area
Purchase History
| Date | Buyer | Sale Price | Title Company |
|---|---|---|---|
| Anto Litto | $580,000 | Equity Title | |
| Dominic Jamb N | -- | Equity Title Company Llc | |
| Dominic Jamie N | -- | Linear Title And Escrow Llc |
Source: Public Records
Mortgage History
| Date | Status | Borrower | Loan Amount |
|---|---|---|---|
| Open | Anto Litto | $464,000 | |
| Previous Owner | Dominic Jamb N | $315,500 | |
| Previous Owner | Dominic Jamie N | $316,000 |
Source: Public Records
Tax History Compared to Growth
Tax History
| Year | Tax Paid | Tax Assessment Tax Assessment Total Assessment is a certain percentage of the fair market value that is determined by local assessors to be the total taxable value of land and additions on the property. | Land | Improvement |
|---|---|---|---|---|
| 2025 | $5,025 | $553,300 | $170,000 | $383,300 |
| 2024 | $5,025 | $518,000 | $170,000 | $348,000 |
| 2023 | $4,835 | $488,400 | $135,000 | $353,400 |
| 2022 | $4,287 | $433,000 | $125,000 | $308,000 |
| 2021 | $4,042 | $408,300 | $118,000 | $290,300 |
| 2020 | $3,846 | $378,000 | $110,000 | $268,000 |
| 2019 | $3,970 | $390,200 | $110,000 | $280,200 |
| 2018 | $3,912 | $390,200 | $110,000 | $280,200 |
| 2017 | $3,654 | $364,500 | $110,000 | $254,500 |
| 2016 | $3,554 | $359,000 | $104,000 | $255,000 |
| 2015 | $3,151 | $318,300 | $80,000 | $238,300 |
Source: Public Records
Map
Nearby Homes
- 2500 Peaceful Ln
- 2413 Dunning Arch
- 2412 Dunning Arch
- 2624 Rochambeau Way
- 2809 Garland Atwater Jr Ct
- 2544 Bombay Landing
- 2824 N Landing Rd
- 2316 M J Beasley Trail
- 2709 Browning Dr
- 2677 Browning Dr
- 2749 Browning Dr
- 2404 Belle Ct
- 2320 Pierce Ln
- 2616 Pulaski Loop
- 1905 Red Barn Dr
- 2525 Alleghany Loop
- 3008 Looking Glass Ct
- 2436 Rockwater Cir
- 1744 Vankar Dr Unit 107
- 3000 N Landing Rd Unit 1
- 2600 Magnolia Green Loop
- 2600 Magnolia Green Loop Unit 12
- 2504 N Landing Rd
- 2608 Magnolia Green Loop Unit 14
- 2608 Magnolia Green Loop
- 2616 Magnolia Green Loop Unit 15
- 2616 Magnolia Green Loop
- 2544 Brewer Arch Unit 37
- 2544 Brewer Arch
- 2540 Brewer Arch Unit 36
- 2540 Brewer Arch
- 2548 Brewer Arch Unit 38
- 2548 Brewer Arch
- 2620 Magnolia Green Loop Unit 16
- 2620 Magnolia Green Loop
- 2560 Magnolia Green Loop Unit 1
- 2560 Magnolia Green Loop
- 2672 James Madison Blvd Unit 20
- 2672 James Madison Blvd
- 2668 James Madison Blvd