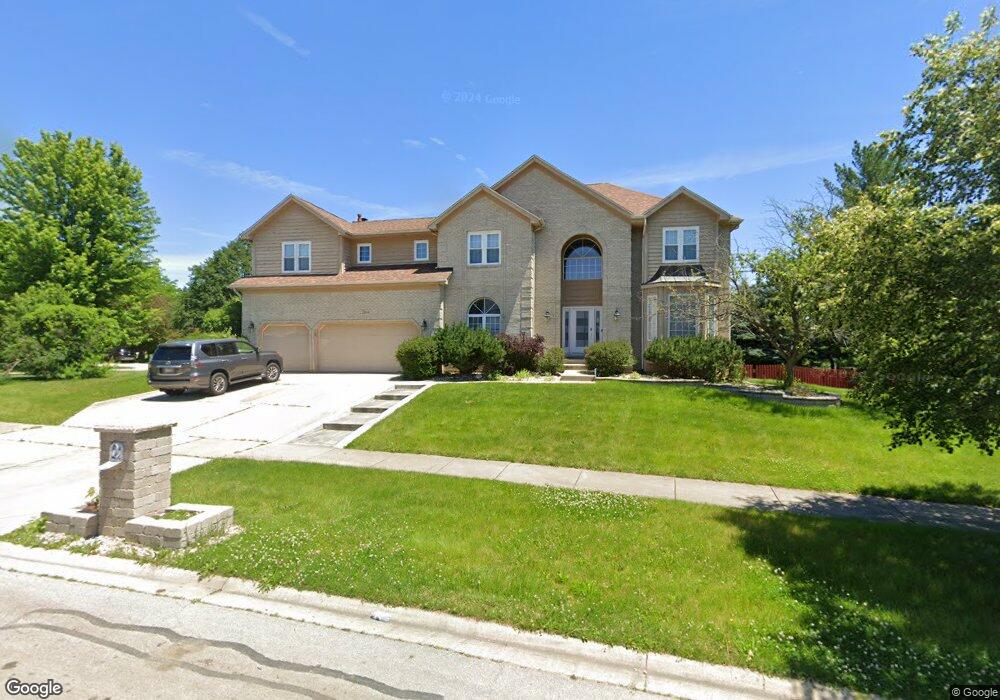
2604 Regency Ct Naperville, IL 60565
Springbrook Prairie NeighborhoodEstimated Value: $934,203 - $959,000
--
Bed
1
Bath
3,706
Sq Ft
$255/Sq Ft
Est. Value
About This Home
This home is located at 2604 Regency Ct, Naperville, IL 60565 and is currently estimated at $945,051, approximately $255 per square foot. 2604 Regency Ct is a home located in Will County with nearby schools including Spring Brook Elementary School, Ellsworth Elementary School, and Gordon Gregory Middle School.
Ownership History
Date
Name
Owned For
Owner Type
Purchase Details
Closed on
Sep 12, 2002
Sold by
Tan Charles W and Tan Lori R
Bought by
Saigal Rahul and Saigal Roshi
Current Estimated Value
Home Financials for this Owner
Home Financials are based on the most recent Mortgage that was taken out on this home.
Original Mortgage
$414,400
Interest Rate
5.87%
Purchase Details
Closed on
Oct 4, 2000
Sold by
Randall John G and Randall Therese G
Bought by
Tan Charles W and Tan Lori R
Purchase Details
Closed on
Oct 29, 1997
Sold by
Harris Bank Naperville
Bought by
Randall John G and Randall Therese G
Home Financials for this Owner
Home Financials are based on the most recent Mortgage that was taken out on this home.
Original Mortgage
$265,000
Interest Rate
7.51%
Create a Home Valuation Report for This Property
The Home Valuation Report is an in-depth analysis detailing your home's value as well as a comparison with similar homes in the area
Home Values in the Area
Average Home Value in this Area
Purchase History
| Date | Buyer | Sale Price | Title Company |
|---|---|---|---|
| Saigal Rahul | $518,000 | -- | |
| Tan Charles W | $507,000 | First American Title | |
| Randall John G | $363,000 | -- |
Source: Public Records
Mortgage History
| Date | Status | Borrower | Loan Amount |
|---|---|---|---|
| Previous Owner | Saigal Rahul | $414,400 | |
| Previous Owner | Randall John G | $265,000 |
Source: Public Records
Tax History Compared to Growth
Tax History
| Year | Tax Paid | Tax Assessment Tax Assessment Total Assessment is a certain percentage of the fair market value that is determined by local assessors to be the total taxable value of land and additions on the property. | Land | Improvement |
|---|---|---|---|---|
| 2024 | $16,243 | $255,984 | $54,739 | $201,245 |
| 2023 | $16,243 | $226,134 | $48,356 | $177,778 |
| 2022 | $15,736 | $222,250 | $45,744 | $176,506 |
| 2021 | $14,981 | $211,667 | $43,566 | $168,101 |
| 2020 | $14,698 | $208,313 | $42,876 | $165,437 |
| 2019 | $14,450 | $202,443 | $41,668 | $160,775 |
| 2018 | $14,202 | $195,582 | $40,751 | $154,831 |
| 2017 | $13,988 | $190,533 | $39,699 | $150,834 |
| 2016 | $13,964 | $186,431 | $38,844 | $147,587 |
| 2015 | $14,425 | $179,261 | $37,350 | $141,911 |
| 2014 | $14,425 | $178,491 | $37,350 | $141,141 |
| 2013 | $14,425 | $178,491 | $37,350 | $141,141 |
Source: Public Records
Map
Nearby Homes
- 1134 Gateshead Dr
- 2741 Gateshead Dr
- 1305 Morningstar Ct Unit 1A
- 1123 Thackery Ln
- 2737 Seiler Dr
- 567 Roxbury Dr
- 1300 Leawood Ct
- 1329 Neskola Ct
- 584 Beaconsfield Ave
- 2224 Flambeau Dr
- 1321 Galena Ct
- 2301 Mecan Dr
- 2206 Gleneagles Dr
- 3004 Bennett Dr
- 945 Winners Cup Ct Unit 945
- 2636 Salix Cir
- 28W555 Leverenz Rd
- 3212 Austin Ct
- 1116 Hollingswood Ave
- 3508 Tussell St
- 908 Gateshead Dr
- 2608 Regency Ct Unit 4
- 904 Gateshead Dr
- 916 Gateshead Dr
- 804 Leverenz Rd
- 2612 Regency Ct
- 807 Leverenz Rd
- 2512 Swandyke Ct
- 2616 Regency Ct
- 2619 Regency Ct
- 808 Leverenz Rd Unit 4
- 920 Gateshead Dr
- 2508 Swandyke Ct
- 2620 Regency Ct Unit 4
- 812 Leverenz Rd
- 811 Leverenz Rd
- 2627 Regency Ct
- 924 Gateshead Dr
- 2511 Swandyke Ct
- 2504 Swandyke Ct