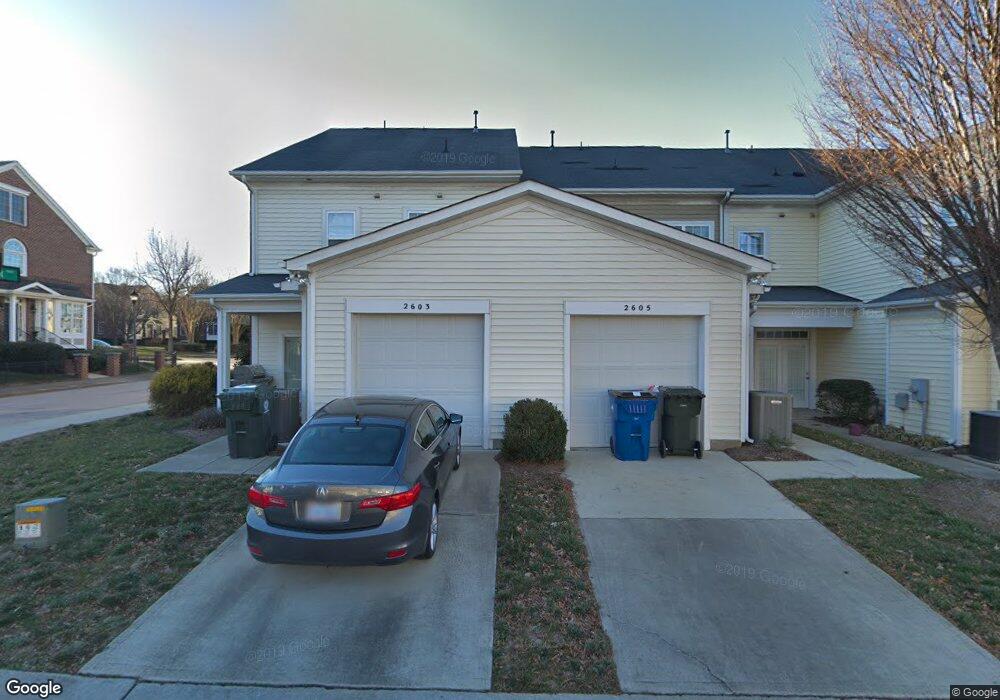
2605 Cloud Mist Cir Raleigh, NC 27614
Bedford at Falls River NeighborhoodEstimated Value: $390,887 - $414,000
2
Beds
3
Baths
1,704
Sq Ft
$236/Sq Ft
Est. Value
About This Home
This home is located at 2605 Cloud Mist Cir, Raleigh, NC 27614 and is currently estimated at $402,722, approximately $236 per square foot. 2605 Cloud Mist Cir is a home located in Wake County with nearby schools including Abbotts Creek Elementary School, Wakefield Middle, and Wakefield High School.
Ownership History
Date
Name
Owned For
Owner Type
Purchase Details
Closed on
Jan 10, 2020
Sold by
Queen Lindsey
Bought by
Queen Lauren Wells
Current Estimated Value
Home Financials for this Owner
Home Financials are based on the most recent Mortgage that was taken out on this home.
Original Mortgage
$247,000
Outstanding Balance
$221,357
Interest Rate
4.37%
Mortgage Type
New Conventional
Estimated Equity
$181,365
Purchase Details
Closed on
Aug 28, 2016
Sold by
Bakis Properties Llc
Bought by
Queen Lindsey
Home Financials for this Owner
Home Financials are based on the most recent Mortgage that was taken out on this home.
Original Mortgage
$205,000
Interest Rate
4.25%
Mortgage Type
Adjustable Rate Mortgage/ARM
Purchase Details
Closed on
Jun 23, 2009
Sold by
1St Ab Inc
Bought by
Bakis Properties Llc
Create a Home Valuation Report for This Property
The Home Valuation Report is an in-depth analysis detailing your home's value as well as a comparison with similar homes in the area
Home Values in the Area
Average Home Value in this Area
Purchase History
| Date | Buyer | Sale Price | Title Company |
|---|---|---|---|
| Queen Lauren Wells | $250,000 | None Available | |
| Queen Lindsey | $210,000 | None Available | |
| Bakis Properties Llc | $180,000 | None Available |
Source: Public Records
Mortgage History
| Date | Status | Borrower | Loan Amount |
|---|---|---|---|
| Open | Queen Lauren Wells | $247,000 | |
| Previous Owner | Queen Lindsey | $205,000 |
Source: Public Records
Tax History Compared to Growth
Tax History
| Year | Tax Paid | Tax Assessment Tax Assessment Total Assessment is a certain percentage of the fair market value that is determined by local assessors to be the total taxable value of land and additions on the property. | Land | Improvement |
|---|---|---|---|---|
| 2025 | $3,108 | $354,044 | $75,000 | $279,044 |
| 2024 | $3,095 | $354,044 | $75,000 | $279,044 |
| 2023 | $2,828 | $257,598 | $40,000 | $217,598 |
| 2022 | $2,628 | $257,598 | $40,000 | $217,598 |
| 2021 | $2,526 | $257,598 | $40,000 | $217,598 |
| 2020 | $2,481 | $257,598 | $40,000 | $217,598 |
| 2019 | $2,499 | $213,884 | $40,000 | $173,884 |
| 2018 | $2,357 | $213,884 | $40,000 | $173,884 |
| 2017 | $2,245 | $213,884 | $40,000 | $173,884 |
| 2016 | $2,199 | $213,884 | $40,000 | $173,884 |
| 2015 | $2,121 | $202,851 | $46,000 | $156,851 |
| 2014 | $2,012 | $202,851 | $46,000 | $156,851 |
Source: Public Records
Map
Nearby Homes
- 2728 Cloud Mist Cir
- 2740 Cloud Mist Cir
- 2704 Snowy Meadow Ct
- 3436 Falls River Ave
- 10638 Cardington Ln
- 10603 Friendly Neighbor Ln
- 3428 van Hessen Dr
- 2408 Gerber Ct
- 3405 van Hessen Dr
- 3606 Silver Forrest Ln
- 2419 Rogerson St
- 2822 Winter Song Rd
- 2231 Cloud Cover
- 10701 Royal Forrest Dr
- 10507 Bedfordtown Dr
- 2106 Cloud Cover
- 10714 Bedfordtown Dr
- 3821 Falls River Ave
- 2200 Caramoor Ln
- 2220 Raven Rd Unit 104
- 2607 Cloud Mist Cir
- 2603 Cloud Mist Cir
- 2609 Cloud Mist Cir
- 2613 Cloud Mist Cir
- 2518 Saint Pauls Square
- 2518 Saint Paul's Square
- 2615 Cloud Mist Cir
- 2606 Cloud Mist Cir
- 2608 Cloud Mist Cir
- 2604 Cloud Mist Cir
- 2610 Cloud Mist Cir
- 2516 Saint Pauls Square
- 2516 Saint Paul's Square
- 2617 Cloud Mist Cir
- 2614 Cloud Mist Cir
- 2514 Saint Pauls Square
- 2514 Saint Paul's Square
- 2619 Cloud Mist Cir
- 2616 Cloud Mist Cir
- 2519 Happy Ln