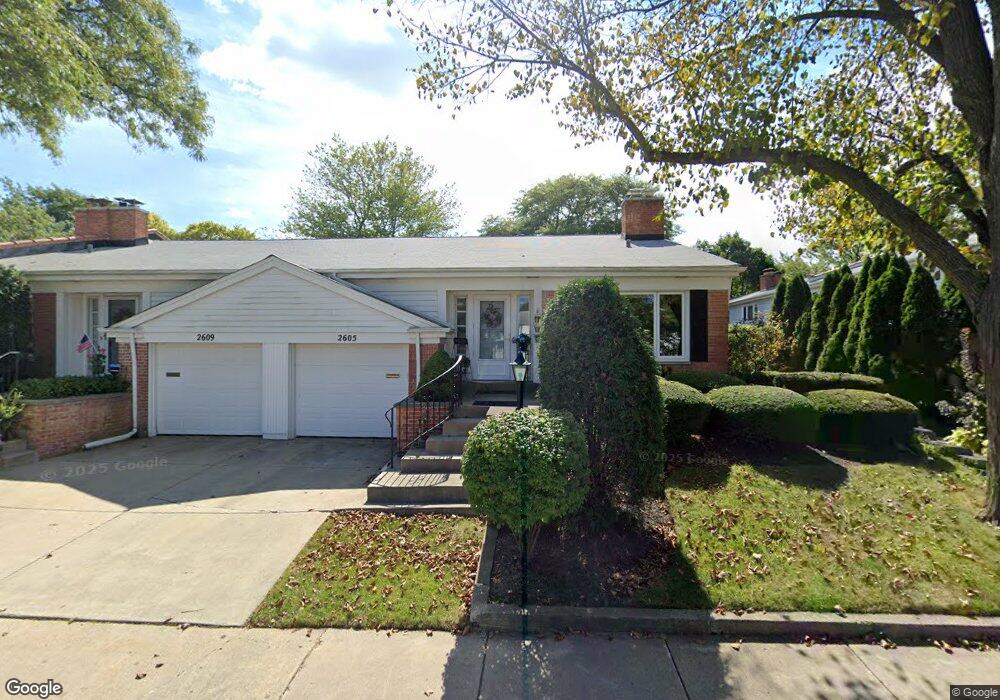
2605 E Bel Aire Dr Unit 1 Arlington Heights, IL 60004
Estimated Value: $361,727 - $393,000
2
Beds
2
Baths
1,476
Sq Ft
$257/Sq Ft
Est. Value
About This Home
This home is located at 2605 E Bel Aire Dr Unit 1, Arlington Heights, IL 60004 and is currently estimated at $379,932, approximately $257 per square foot. 2605 E Bel Aire Dr Unit 1 is a home located in Cook County with nearby schools including Dryden Elementary School, South Middle School, and Prospect High School.
Ownership History
Date
Name
Owned For
Owner Type
Purchase Details
Closed on
Mar 9, 2016
Sold by
Alspaugh Christine
Bought by
Alspaugh Christine M and The Christine M Alspaugh Trust
Current Estimated Value
Purchase Details
Closed on
Oct 15, 2015
Sold by
Fisher John and Fisher Jeri
Bought by
Alspaugh Christine
Home Financials for this Owner
Home Financials are based on the most recent Mortgage that was taken out on this home.
Original Mortgage
$135,000
Outstanding Balance
$107,950
Interest Rate
4.37%
Mortgage Type
New Conventional
Estimated Equity
$271,982
Purchase Details
Closed on
Nov 1, 2010
Sold by
Thalin Jenifer
Bought by
Fisher John and Fisher Jeri
Home Financials for this Owner
Home Financials are based on the most recent Mortgage that was taken out on this home.
Original Mortgage
$209,700
Interest Rate
4.17%
Mortgage Type
New Conventional
Purchase Details
Closed on
Aug 18, 2005
Sold by
Kries Robert J and Kries Gloria M
Bought by
Thalin Jenifer
Create a Home Valuation Report for This Property
The Home Valuation Report is an in-depth analysis detailing your home's value as well as a comparison with similar homes in the area
Home Values in the Area
Average Home Value in this Area
Purchase History
| Date | Buyer | Sale Price | Title Company |
|---|---|---|---|
| Alspaugh Christine M | -- | None Available | |
| Alspaugh Christine | $235,000 | First American Title | |
| Fisher John | $233,000 | Attorneys Title Guaranty Fun | |
| Thalin Jenifer | $295,000 | Multiple |
Source: Public Records
Mortgage History
| Date | Status | Borrower | Loan Amount |
|---|---|---|---|
| Open | Alspaugh Christine | $135,000 | |
| Previous Owner | Fisher John | $209,700 |
Source: Public Records
Tax History Compared to Growth
Tax History
| Year | Tax Paid | Tax Assessment Tax Assessment Total Assessment is a certain percentage of the fair market value that is determined by local assessors to be the total taxable value of land and additions on the property. | Land | Improvement |
|---|---|---|---|---|
| 2024 | $3,584 | $28,000 | $5,000 | $23,000 |
| 2023 | $3,562 | $28,000 | $5,000 | $23,000 |
| 2022 | $3,562 | $28,000 | $5,000 | $23,000 |
| 2021 | $3,961 | $23,152 | $2,248 | $20,904 |
| 2020 | $3,594 | $23,152 | $2,248 | $20,904 |
| 2019 | $3,559 | $25,811 | $2,248 | $23,563 |
| 2018 | $3,768 | $19,630 | $1,955 | $17,675 |
| 2017 | $3,758 | $19,630 | $1,955 | $17,675 |
| 2016 | $4,965 | $22,538 | $1,955 | $20,583 |
| 2015 | $5,467 | $18,423 | $1,662 | $16,761 |
| 2014 | $5,290 | $18,423 | $1,662 | $16,761 |
| 2013 | $5,160 | $18,423 | $1,662 | $16,761 |
Source: Public Records
Map
Nearby Homes
- 2700 E Bel Aire Dr Unit 104
- 101 N Peartree Ln Unit 101
- 2405 E Miner St
- 25 N Prindle Ave
- 719 N Elmhurst Ave
- 428 S Phelps Ave
- 201 S Stratford Rd
- 710 Creekside Dr Unit 506A
- 1615 E Miner St
- 730 Creekside Dr Unit 405C
- 108 N Meadow Ln
- 706 N Main St
- 415 N Russel St
- 315 N Drury Ln
- 910 Persimmon Ln Unit A
- 1401 Plum Ct Unit D
- 1311 Nutmeg Ct Unit A
- 802 Butternut Ln Unit D
- 802 Butternut Ln Unit C
- 1255 W Prospect Ave Unit 208
- 2605 E Bel Aire Dr Unit 2605
- 2609 E Bel Aire Dr
- 1 S Regency Dr W
- 2617 E Bel Aire Dr
- 3 S Regency Dr W
- 5 S Regency Dr W
- 9 S Regency Ct W
- 11 S Regency Ct W
- 2619 E Bel Aire Dr
- 7 S Regency Dr W
- 15 S Regency Ct W Unit 1
- 2623 E Bel Aire Dr
- 2616 E Bel Aire Dr
- 2608 E Bel Aire Dr
- 2627 E Bel Aire Dr Unit 1
- 2604 E Bel Aire Dr Unit 1
- 17 S Regency Ct W
- 2631 E Bel Aire Dr
- 14 S Regency Dr W
- 6 S Regency Dr W