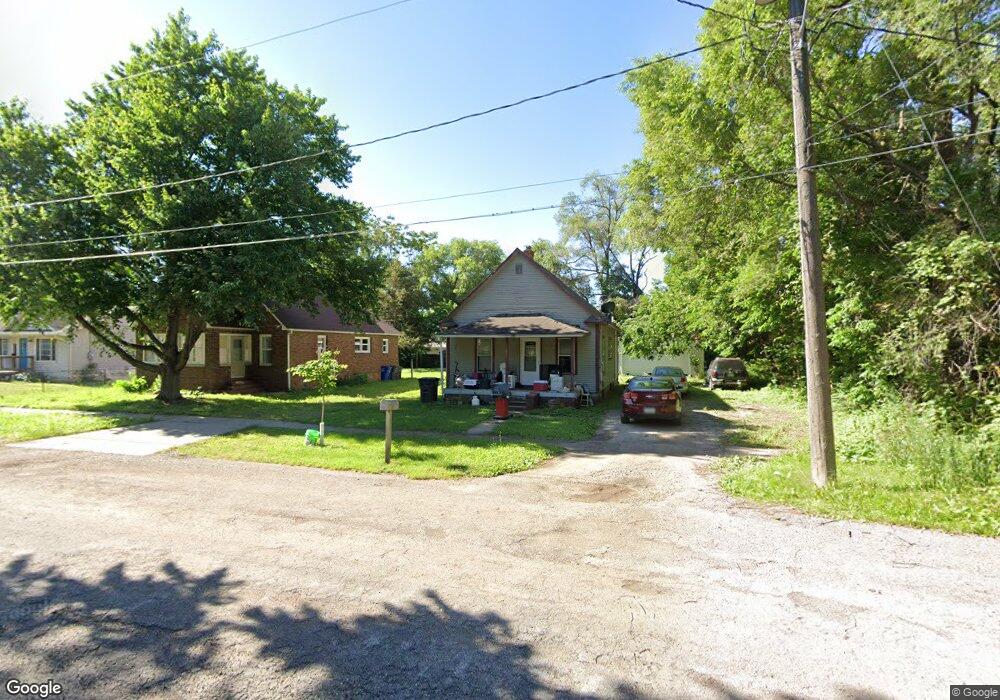
2605 E Elm St Des Moines, IA 50317
Chesterfield NeighborhoodEstimated Value: $122,527 - $135,000
2
Beds
1
Bath
644
Sq Ft
$204/Sq Ft
Est. Value
About This Home
This home is located at 2605 E Elm St, Des Moines, IA 50317 and is currently estimated at $131,132, approximately $203 per square foot. 2605 E Elm St is a home located in Polk County with nearby schools including Willard Elementary School, Hoyt Middle School, and East High School.
Ownership History
Date
Name
Owned For
Owner Type
Purchase Details
Closed on
Oct 20, 2001
Sold by
Tax Acquisitions Xtraordinaire Llc
Bought by
Mongar Steve B and Mongar Kathy S
Current Estimated Value
Home Financials for this Owner
Home Financials are based on the most recent Mortgage that was taken out on this home.
Original Mortgage
$38,800
Outstanding Balance
$14,999
Interest Rate
6.72%
Estimated Equity
$116,133
Purchase Details
Closed on
Nov 8, 2000
Sold by
5914 Tonka Llc
Bought by
Tax Acquisitions Xtraordinaire Llc
Purchase Details
Closed on
Jun 19, 2000
Sold by
Tax 50
Bought by
5914 Tonka Llc
Purchase Details
Closed on
May 23, 2000
Sold by
Maloney Mary
Bought by
Tax 50
Create a Home Valuation Report for This Property
The Home Valuation Report is an in-depth analysis detailing your home's value as well as a comparison with similar homes in the area
Home Values in the Area
Average Home Value in this Area
Purchase History
| Date | Buyer | Sale Price | Title Company |
|---|---|---|---|
| Mongar Steve B | $39,500 | -- | |
| Tax Acquisitions Xtraordinaire Llc | -- | -- | |
| Tax Acquisitions Xtraordinaire Llc | -- | -- | |
| 5914 Tonka Llc | -- | -- | |
| Tax 50 | $119 | -- |
Source: Public Records
Mortgage History
| Date | Status | Borrower | Loan Amount |
|---|---|---|---|
| Open | Mongar Steve B | $38,800 |
Source: Public Records
Tax History Compared to Growth
Tax History
| Year | Tax Paid | Tax Assessment Tax Assessment Total Assessment is a certain percentage of the fair market value that is determined by local assessors to be the total taxable value of land and additions on the property. | Land | Improvement |
|---|---|---|---|---|
| 2025 | $1,290 | $95,500 | $10,600 | $84,900 |
| 2024 | $1,290 | $83,100 | $9,200 | $73,900 |
| 2023 | $1,366 | $83,100 | $9,200 | $73,900 |
| 2022 | $1,352 | $66,800 | $8,000 | $58,800 |
| 2021 | $1,250 | $66,800 | $8,000 | $58,800 |
| 2020 | $1,294 | $58,700 | $7,100 | $51,600 |
| 2019 | $1,136 | $58,700 | $7,100 | $51,600 |
| 2018 | $1,120 | $50,800 | $6,000 | $44,800 |
| 2017 | $1,098 | $50,800 | $6,000 | $44,800 |
| 2016 | $1,064 | $49,100 | $5,800 | $43,300 |
| 2015 | $1,064 | $49,100 | $5,800 | $43,300 |
| 2014 | $1,066 | $48,800 | $5,600 | $43,200 |
Source: Public Records
Map
Nearby Homes