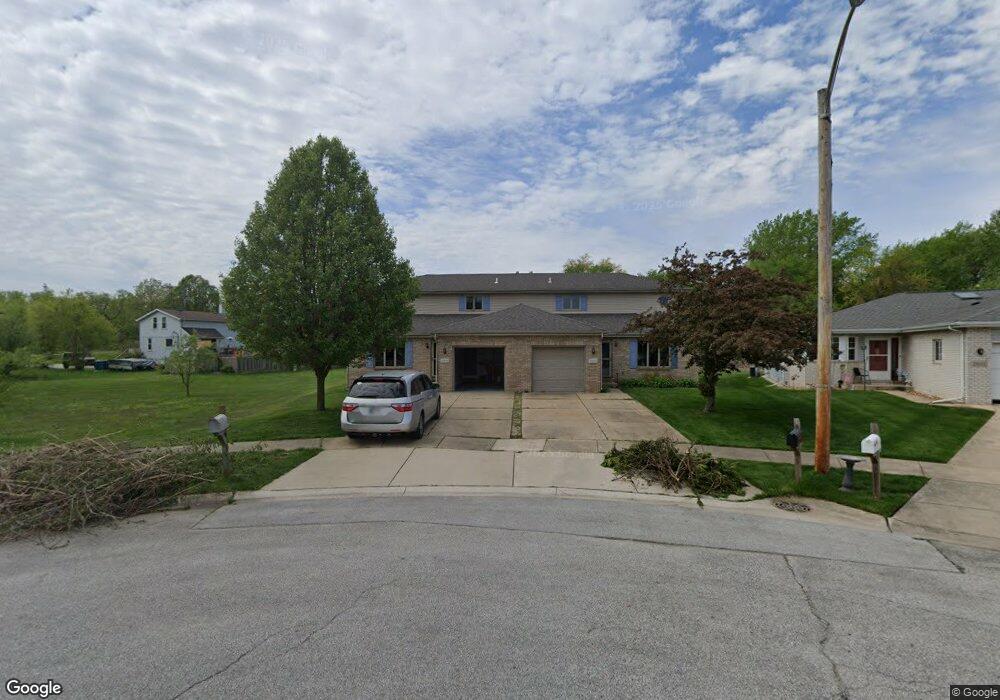
2606 41st Place Highland, IN 46322
Estimated Value: $227,000 - $407,000
4
Beds
2
Baths
2,946
Sq Ft
$112/Sq Ft
Est. Value
About This Home
This home is located at 2606 41st Place, Highland, IN 46322 and is currently estimated at $329,282, approximately $111 per square foot. 2606 41st Place is a home located in Lake County with nearby schools including Highland High School, Highland Christian School, and Our Lady Of Grace School.
Ownership History
Date
Name
Owned For
Owner Type
Purchase Details
Closed on
Oct 4, 2024
Sold by
Bach Joint Revocable Trust and Bach John M
Bought by
Golden Thomas and Golden Carolyn J
Current Estimated Value
Home Financials for this Owner
Home Financials are based on the most recent Mortgage that was taken out on this home.
Original Mortgage
$182,750
Outstanding Balance
$180,829
Interest Rate
6.35%
Mortgage Type
New Conventional
Estimated Equity
$148,453
Purchase Details
Closed on
Aug 7, 2024
Sold by
Bach Joint Revocable Trust and Bach John M
Bought by
Boskovich Laurel L
Home Financials for this Owner
Home Financials are based on the most recent Mortgage that was taken out on this home.
Original Mortgage
$182,750
Outstanding Balance
$180,829
Interest Rate
6.35%
Mortgage Type
New Conventional
Estimated Equity
$148,453
Purchase Details
Closed on
May 10, 2021
Sold by
Bach John M and Bach Susan D
Bought by
Bach John M and Bach Susan D
Create a Home Valuation Report for This Property
The Home Valuation Report is an in-depth analysis detailing your home's value as well as a comparison with similar homes in the area
Home Values in the Area
Average Home Value in this Area
Purchase History
| Date | Buyer | Sale Price | Title Company |
|---|---|---|---|
| Golden Thomas | $215,000 | Greater Indiana Title Company | |
| Boskovich Laurel L | -- | Community Title Company | |
| Bach John M | -- | None Available |
Source: Public Records
Mortgage History
| Date | Status | Borrower | Loan Amount |
|---|---|---|---|
| Open | Golden Thomas | $182,750 |
Source: Public Records
Tax History Compared to Growth
Tax History
| Year | Tax Paid | Tax Assessment Tax Assessment Total Assessment is a certain percentage of the fair market value that is determined by local assessors to be the total taxable value of land and additions on the property. | Land | Improvement |
|---|---|---|---|---|
| 2024 | $9,269 | $391,700 | $52,800 | $338,900 |
| 2023 | $7,146 | $357,200 | $52,800 | $304,400 |
| 2022 | $6,839 | $341,900 | $52,800 | $289,100 |
| 2021 | $5,986 | $299,200 | $33,000 | $266,200 |
| 2020 | $5,582 | $279,100 | $33,000 | $246,100 |
| 2019 | $5,407 | $268,100 | $33,000 | $235,100 |
| 2018 | $5,825 | $246,000 | $33,000 | $213,000 |
| 2017 | $6,046 | $251,200 | $33,000 | $218,200 |
| 2016 | $6,269 | $261,400 | $33,000 | $228,400 |
| 2014 | $5,827 | $244,400 | $33,000 | $211,400 |
| 2013 | $5,900 | $253,800 | $33,000 | $220,800 |
Source: Public Records
Map
Nearby Homes
- 2609 41st St
- 8032 Kennedy Ave
- 9505 Kennedy Ave
- 2702 Martha St
- 2440 Martha St
- 9117 Kennedy Ave
- 2841 43rd St
- 2620 Parkway Dr
- 2529 Longwood Dr
- 9235 Waymond Ave Unit 1
- 9409 5th St
- 2741 41st St
- 2649 Georgetowne Dr Unit B2
- 2305 Martha St Unit D2
- 2291 Martha St Unit B2
- 3010 43rd St
- 8952 Branton Ave
- 9436 Anthony Place
- 9210 Woodward Ave
- 2117 Azalea Dr
- 2604 41st Place
- 2603 41st Place
- 2605 41st Place
- 2609 41st Place
- 2611 41st Place
- 2607 Hart Rd
- 2601 Hart Rd
- 2616 41st Place Unit 2618
- 2617 41st Place
- 2628 41st Place
- 2628 41st Place
- 2619 41st Place
- 2619 Hart Rd
- 2626 41st Place
- 2623 41st Place
- 2606 41st St
- 2610 41st St
- 2541 Hart Rd
- 2625 41st Place
- 2614 41st St