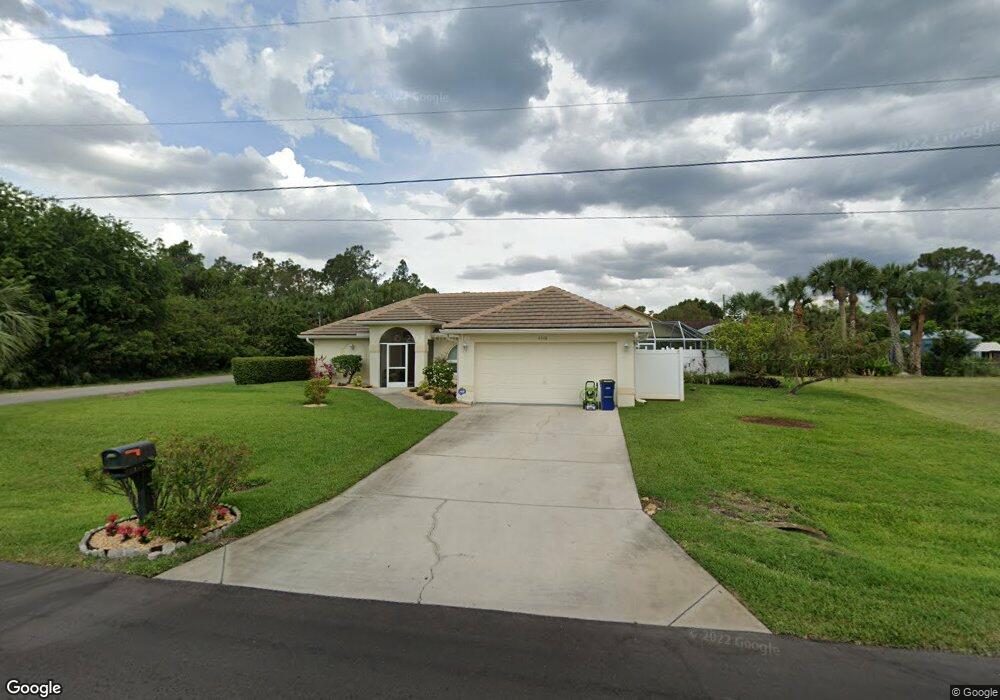
2606 E 5th St Lehigh Acres, FL 33936
Joel NeighborhoodEstimated Value: $287,000 - $322,000
3
Beds
2
Baths
1,409
Sq Ft
$211/Sq Ft
Est. Value
About This Home
This home is located at 2606 E 5th St, Lehigh Acres, FL 33936 and is currently estimated at $297,653, approximately $211 per square foot. 2606 E 5th St is a home located in Lee County with nearby schools including Lehigh Elementary School, The Alva School, and Gateway Elementary School.
Ownership History
Date
Name
Owned For
Owner Type
Purchase Details
Closed on
Jun 10, 2013
Sold by
Hufnagel James and Hufnagel Joanne
Bought by
Hufnagel Joanne Elizabeth
Current Estimated Value
Purchase Details
Closed on
Dec 18, 2009
Sold by
Lehigh Funding Group Lllp
Bought by
Hufnagel James and Hufnagel Joanne
Purchase Details
Closed on
Jul 7, 2009
Sold by
Estevez Jesus
Bought by
Lehigh Funding Group Lllp
Purchase Details
Closed on
Dec 29, 2006
Sold by
Dawson Robert and Dawson Dianne
Bought by
Estevez Jesus
Home Financials for this Owner
Home Financials are based on the most recent Mortgage that was taken out on this home.
Original Mortgage
$261,900
Interest Rate
6.1%
Mortgage Type
Unknown
Purchase Details
Closed on
Nov 30, 2003
Sold by
Steinlechner Hildegard and Limone Sabine
Bought by
Dawson Robert and Dawson Dianne
Create a Home Valuation Report for This Property
The Home Valuation Report is an in-depth analysis detailing your home's value as well as a comparison with similar homes in the area
Home Values in the Area
Average Home Value in this Area
Purchase History
| Date | Buyer | Sale Price | Title Company |
|---|---|---|---|
| Hufnagel Joanne Elizabeth | $71,000 | None Available | |
| Hufnagel James | $92,500 | Platinum Land Title Agency I | |
| Lehigh Funding Group Lllp | $63,800 | None Available | |
| Estevez Jesus | $261,900 | Realty Title Services Of For | |
| Dawson Robert | $12,000 | -- |
Source: Public Records
Mortgage History
| Date | Status | Borrower | Loan Amount |
|---|---|---|---|
| Previous Owner | Estevez Jesus | $261,900 |
Source: Public Records
Tax History
| Year | Tax Paid | Tax Assessment Tax Assessment Total Assessment is a certain percentage of the fair market value that is determined by local assessors to be the total taxable value of land and additions on the property. | Land | Improvement |
|---|---|---|---|---|
| 2025 | $3,642 | $227,644 | -- | -- |
| 2024 | $3,503 | $206,949 | -- | -- |
Source: Public Records
Map
Nearby Homes
- 4400 E 5th St
- 506 Causeway Dr
- 409 Mcarthur Ave
- 503 Jackson Ave
- 403 Mcarthur Ave
- 516 Roosevelt Ave Unit 5
- 1904 E 6th St
- 2312 Orange St
- 412 Mcarthur Ave
- 414 Mcarthur Ave
- 220 Roosevelt Ave
- 521 Roosevelt Ave
- 910 Roosevelt Ave
- 905 Roosevelt Ave
- 306 Roosevelt Ave
- 1112 Roosevelt Ave
- 2524 Lakeview Dr
- 420 Hamilton Ave
- 2201 Croton Ct
- 2900 E 6th St
- 419 Roosevelt Ave
- 2605 E 5th St
- 2603 E 5th St
- 417 Roosevelt Ave
- 2602 E 5th St
- 2702 E 5th St
- 2601 E 5th St
- 416 Roosevelt Ave
- 2600 E 5th St
- 415 Roosevelt Ave
- 416 Jefferson Ave
- 414 Jefferson Ave
- 413 Roosevelt Ave
- 423 Mcarthur Ave
- 419 Mcarthur Ave
- 507 Causeway Dr
- 509 Causeway Dr
- 2508 E 5th St
- 417 Mcarthur Ave Unit 2
- 417 Mcarthur Ave
Your Personal Tour Guide
Ask me questions while you tour the home.