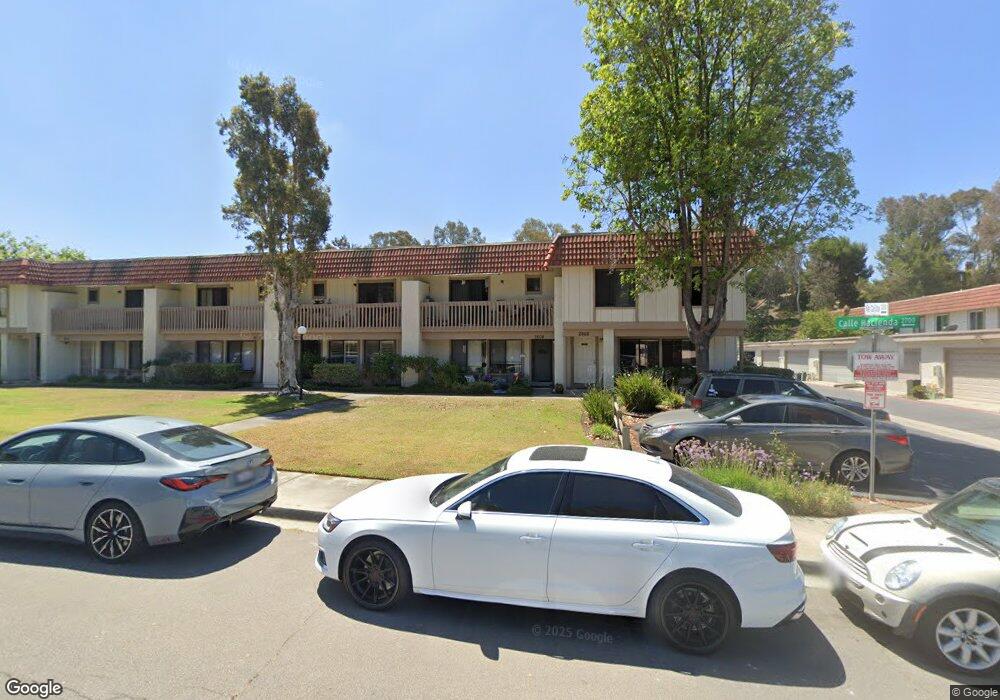
2606 Via Masada Carlsbad, CA 92010
Tamarack Point NeighborhoodEstimated Value: $805,000 - $1,006,000
3
Beds
3
Baths
1,496
Sq Ft
$592/Sq Ft
Est. Value
About This Home
This home is located at 2606 Via Masada, Carlsbad, CA 92010 and is currently estimated at $886,315, approximately $592 per square foot. 2606 Via Masada is a home located in San Diego County with nearby schools including Buena Vista Elementary, Carlsbad High School, and Sage Creek High.
Ownership History
Date
Name
Owned For
Owner Type
Purchase Details
Closed on
Sep 12, 2012
Sold by
Ismail Shabbir
Bought by
Ismail Shabbir
Current Estimated Value
Purchase Details
Closed on
Mar 29, 2010
Sold by
Ismail Shabbir
Bought by
Ismail Shabbir
Purchase Details
Closed on
Jul 4, 2003
Sold by
Gutierrez Michelle L
Bought by
Ismail Shabbir and Ismail Shareen L
Home Financials for this Owner
Home Financials are based on the most recent Mortgage that was taken out on this home.
Original Mortgage
$254,500
Outstanding Balance
$100,932
Interest Rate
4.37%
Mortgage Type
Unknown
Estimated Equity
$785,383
Purchase Details
Closed on
Oct 19, 2001
Sold by
Machamer Philip C and Machamer Jane E
Bought by
Gutierrez Michelle L
Home Financials for this Owner
Home Financials are based on the most recent Mortgage that was taken out on this home.
Original Mortgage
$225,055
Interest Rate
6.67%
Purchase Details
Closed on
Jul 30, 1986
Create a Home Valuation Report for This Property
The Home Valuation Report is an in-depth analysis detailing your home's value as well as a comparison with similar homes in the area
Home Values in the Area
Average Home Value in this Area
Purchase History
| Date | Buyer | Sale Price | Title Company |
|---|---|---|---|
| Ismail Shabbir | -- | None Available | |
| Ismail Shabbir | -- | None Available | |
| Ismail Shabbir | $319,500 | Southland Title | |
| Gutierrez Michelle L | $237,000 | Chicago Title Co | |
| -- | $99,000 | -- |
Source: Public Records
Mortgage History
| Date | Status | Borrower | Loan Amount |
|---|---|---|---|
| Open | Ismail Shabbir | $254,500 | |
| Previous Owner | Gutierrez Michelle L | $225,055 |
Source: Public Records
Tax History Compared to Growth
Tax History
| Year | Tax Paid | Tax Assessment Tax Assessment Total Assessment is a certain percentage of the fair market value that is determined by local assessors to be the total taxable value of land and additions on the property. | Land | Improvement |
|---|---|---|---|---|
| 2025 | $4,781 | $454,250 | $270,134 | $184,116 |
| 2024 | $4,781 | $445,344 | $264,838 | $180,506 |
| 2023 | $4,756 | $436,613 | $259,646 | $176,967 |
| 2022 | $4,683 | $428,053 | $254,555 | $173,498 |
| 2021 | $4,648 | $419,661 | $249,564 | $170,097 |
| 2020 | $4,617 | $415,359 | $247,006 | $168,353 |
| 2019 | $4,534 | $407,215 | $242,163 | $165,052 |
| 2018 | $4,342 | $399,231 | $237,415 | $161,816 |
| 2017 | $4,270 | $391,404 | $232,760 | $158,644 |
| 2016 | $4,098 | $383,731 | $228,197 | $155,534 |
| 2015 | $3,676 | $340,000 | $201,000 | $139,000 |
| 2014 | $3,687 | $340,000 | $201,000 | $139,000 |
Source: Public Records
Map
Nearby Homes
- 2334 Kimberly Ct
- 2517 Via Astuto Unit 1
- 3442 Celinda Dr
- 3354 Seacrest Dr
- 3190 Falcon Dr
- 3365 Seacrest Dr
- 2360 Hosp Way Unit 331
- 2195 Basswood Ave
- 3306 Donna Dr
- 2336 Hosp Way Unit 314
- 2360 Paseo de Laura Unit 2
- 2035 Basswood Ave
- 2225 David Place
- 3072 Marron Rd
- 2732 Forest Park Ln
- 2062 Avenue of The Trees
- 3304 Telaga Rd
- 3736 Donna Ct
- 2755 Victoria Ave
- 3721 Donna Ct
- 2604 Via Masada
- 2608 Via Masada
- 2602 Via Masada
- 2610 Via Masada
- 2612 Via Masada
- 2614 Via Masada
- 2605 Via Masada
- 2603 Via Masada
- 2607 Via Masada
- 2609 Via Masada
- 2601 Via Masada
- 3207 Via Cajita
- 3203 Via Cajita
- 2611 Via Masada
- 3201 Via Cajita
- 3209 Via Cajita
- 3211 Via Cajita
- 2613 Via Masada
- 3213 Via Cajita
- 2615 Via Masada