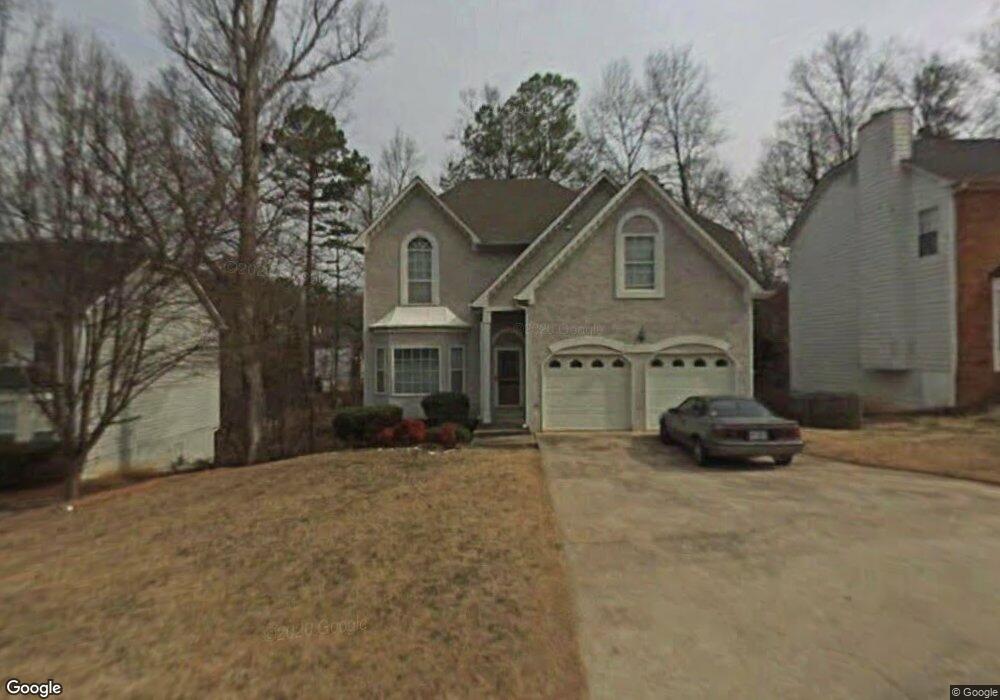
2607 Haversack Ct SW Marietta, GA 30008
Southwestern Marietta NeighborhoodEstimated Value: $355,000 - $453,000
3
Beds
3
Baths
2,082
Sq Ft
$188/Sq Ft
Est. Value
About This Home
This home is located at 2607 Haversack Ct SW, Marietta, GA 30008 and is currently estimated at $392,385, approximately $188 per square foot. 2607 Haversack Ct SW is a home located in Cobb County with nearby schools including Milford Elementary School, Smitha Middle School, and Osborne High School.
Ownership History
Date
Name
Owned For
Owner Type
Purchase Details
Closed on
Jun 25, 2010
Sold by
Wells Fargo Bk Na
Bought by
Abrams Anita A
Current Estimated Value
Home Financials for this Owner
Home Financials are based on the most recent Mortgage that was taken out on this home.
Original Mortgage
$103,682
Outstanding Balance
$68,803
Interest Rate
4.77%
Mortgage Type
VA
Estimated Equity
$323,583
Purchase Details
Closed on
Dec 1, 2009
Sold by
Hubbard Charles
Bought by
Wells Fargo Bk Na
Purchase Details
Closed on
Sep 7, 2004
Sold by
Davis Donna G
Bought by
Provident Bank
Purchase Details
Closed on
Apr 28, 1997
Sold by
Esemuede John O
Bought by
Davis Ronald A and Davis Donna
Home Financials for this Owner
Home Financials are based on the most recent Mortgage that was taken out on this home.
Original Mortgage
$127,500
Interest Rate
7.5%
Mortgage Type
VA
Create a Home Valuation Report for This Property
The Home Valuation Report is an in-depth analysis detailing your home's value as well as a comparison with similar homes in the area
Home Values in the Area
Average Home Value in this Area
Purchase History
| Date | Buyer | Sale Price | Title Company |
|---|---|---|---|
| Abrams Anita A | $101,500 | -- | |
| Wells Fargo Bk Na | $129,105 | -- | |
| Provident Bank | $171,646 | -- | |
| Davis Ronald A | $125,000 | -- |
Source: Public Records
Mortgage History
| Date | Status | Borrower | Loan Amount |
|---|---|---|---|
| Open | Abrams Anita A | $103,682 | |
| Previous Owner | Davis Ronald A | $127,500 |
Source: Public Records
Tax History Compared to Growth
Tax History
| Year | Tax Paid | Tax Assessment Tax Assessment Total Assessment is a certain percentage of the fair market value that is determined by local assessors to be the total taxable value of land and additions on the property. | Land | Improvement |
|---|---|---|---|---|
| 2025 | $1,040 | $169,788 | $28,000 | $141,788 |
| 2024 | $1,145 | $169,788 | $28,000 | $141,788 |
| 2023 | $0 | $123,620 | $15,200 | $108,420 |
| 2022 | $2,108 | $89,316 | $14,000 | $75,316 |
| 2021 | $2,108 | $89,316 | $14,000 | $75,316 |
| 2020 | $1,833 | $76,736 | $14,000 | $62,736 |
| 2019 | $1,612 | $66,632 | $10,000 | $56,632 |
| 2018 | $1,612 | $66,632 | $10,000 | $56,632 |
| 2017 | $1,408 | $60,188 | $10,000 | $50,188 |
| 2016 | $1,410 | $60,188 | $10,000 | $50,188 |
| 2015 | $1,102 | $46,252 | $8,800 | $37,452 |
| 2014 | $1,112 | $46,252 | $0 | $0 |
Source: Public Records
Map
Nearby Homes
- 1345 Windage Ct SW Unit 6
- 2615 Windage Dr SW
- 1104 Havel Dr SW
- 1086 Mornington Way
- 1308 Willamette Way
- 1105 Woodleigh Rd SW
- 3075 Milford Chase SW
- 2964 Edgemont Ln SW
- 1197 Woodleigh Rd SW
- 2907 Crest Ridge Ct SW
- 2381 Lakeside Place SW
- 2379 Moseley Place SW
- 2976 Michael Dr SW
- 881 Whittington Pkwy
- 3004 Michael Dr SW
- 1020 Hicksmil Dr SW
- 2605 Haversack Ct SW
- 2609 Haversack Ct SW
- 1120 Havel Dr SW
- 2611 Haversack Ct SW
- 2603 Haversack Ct SW
- 1118 Havel Dr SW
- 2606 Haversack Ct SW
- 2604 Haversack Ct SW Unit 84
- 2604 Haversack Ct SW
- 2601 Haversack Ct SW
- 2613 Haversack Ct SW
- 1119 Havel Dr SW
- 0 Haversack Ct SW Unit 7626198
- 0 Haversack Ct SW Unit 7152859
- 0 Haversack Ct SW Unit 3212484
- 0 Haversack Ct SW Unit 3249674
- 0 Haversack Ct SW Unit 7100360
- 0 Haversack Ct SW
- 2608 Haversack Ct SW Unit VI
- 1116 Havel Dr SW