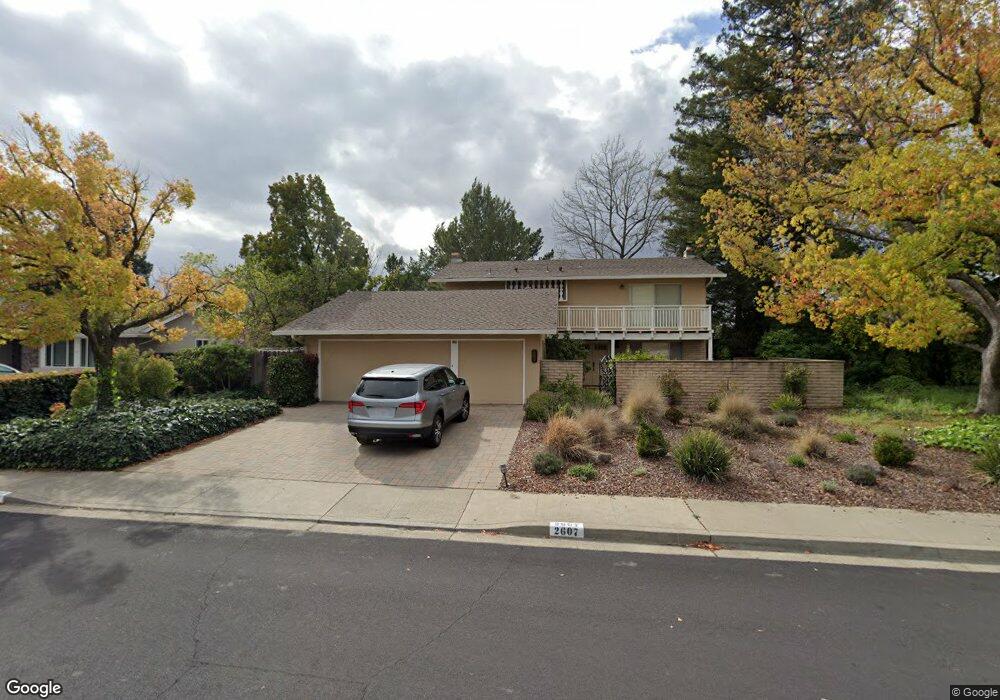
2607 Lariat Ln Walnut Creek, CA 94596
Estimated Value: $1,665,000 - $1,834,327
4
Beds
3
Baths
2,295
Sq Ft
$760/Sq Ft
Est. Value
About This Home
This home is located at 2607 Lariat Ln, Walnut Creek, CA 94596 and is currently estimated at $1,744,832, approximately $760 per square foot. 2607 Lariat Ln is a home located in Contra Costa County with nearby schools including Alamo Elementary School, Stone Valley Middle School, and Monte Vista High School.
Ownership History
Date
Name
Owned For
Owner Type
Purchase Details
Closed on
Jul 9, 2020
Sold by
Hodgson William J and Hodgson Erin E
Bought by
Hodgson William J and Hodgson Erin E
Current Estimated Value
Purchase Details
Closed on
Apr 4, 2018
Sold by
Riney Mary Ann
Bought by
Hodgson William J and Hodgson Erin E
Home Financials for this Owner
Home Financials are based on the most recent Mortgage that was taken out on this home.
Original Mortgage
$963,750
Outstanding Balance
$828,037
Interest Rate
4.4%
Mortgage Type
New Conventional
Estimated Equity
$916,795
Purchase Details
Closed on
Apr 16, 2007
Sold by
Riney Thomas Edward and Riney Mary Ann
Bought by
Riney Thomas Edward and Riney Mary Ann
Create a Home Valuation Report for This Property
The Home Valuation Report is an in-depth analysis detailing your home's value as well as a comparison with similar homes in the area
Home Values in the Area
Average Home Value in this Area
Purchase History
| Date | Buyer | Sale Price | Title Company |
|---|---|---|---|
| Hodgson William J | -- | None Available | |
| Hodgson William J | $1,285,000 | Chicago Title Company | |
| Riney Thomas Edward | -- | None Available |
Source: Public Records
Mortgage History
| Date | Status | Borrower | Loan Amount |
|---|---|---|---|
| Open | Hodgson William J | $963,750 |
Source: Public Records
Tax History Compared to Growth
Tax History
| Year | Tax Paid | Tax Assessment Tax Assessment Total Assessment is a certain percentage of the fair market value that is determined by local assessors to be the total taxable value of land and additions on the property. | Land | Improvement |
|---|---|---|---|---|
| 2025 | $16,376 | $1,462,104 | $1,080,935 | $381,169 |
| 2024 | $16,123 | $1,433,437 | $1,059,741 | $373,696 |
| 2023 | $16,123 | $1,405,331 | $1,038,962 | $366,369 |
| 2022 | $16,003 | $1,377,777 | $1,018,591 | $359,186 |
| 2021 | $15,661 | $1,350,763 | $998,619 | $352,144 |
| 2019 | $15,348 | $1,310,700 | $969,000 | $341,700 |
| 2018 | $3,317 | $238,839 | $95,528 | $143,311 |
| 2017 | $3,188 | $234,156 | $93,655 | $140,501 |
| 2016 | $2,981 | $229,566 | $91,819 | $137,747 |
| 2015 | $2,923 | $226,118 | $90,440 | $135,678 |
| 2014 | $2,863 | $221,690 | $88,669 | $133,021 |
Source: Public Records
Map
Nearby Homes
- 1305 Chesterton Way
- 31 Arabian Ct
- 2673 Velvet Way
- 2409 Lavender Dr
- 32 Pacer Place
- 77 Pleasant Knoll Ct
- 234 Acacia Ln
- 1271 Laverock Ln
- 136 Sugarloaf Ct
- 1092 Hillendale Ct
- 1555 Pebblebrook Ct
- 26 Via Alondra Ct
- 210 Likely Dr
- 2129 Youngs Ct
- 1408 Entrada Verde
- 721 Fair Oaks Dr
- 420 Livorna Rd
- 957 Ina Dr
- 2559 Romley Ln
- 2990 Limestone Rd
- 2543 Lariat Ln
- 2621 Lariat Ln
- 2614 Lariat Ln
- 857 Appaloosa Dr
- 2633 Lariat Ln
- 869 Appaloosa Dr
- 2537 Lariat Ln
- 2546 Lariat Ln
- 2534 Lariat Ln
- 839 Appaloosa Dr
- 877 Appaloosa Dr
- 2493 Lariat Ln
- 2645 Lariat Ln
- 2516 Dapplegray Ln
- 2638 Lariat Ln
- 2528 Dapplegray Ln
- 2492 Lariat Ln
- 832 Appaloosa Dr
- 121 Samantha Ct
- 881 Appaloosa Dr