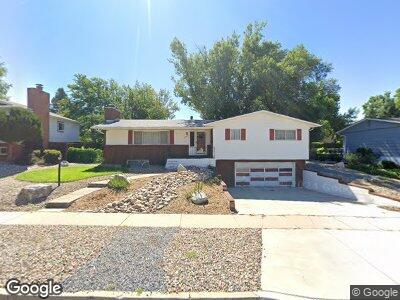
2607 Logan Cir Colorado Springs, CO 80907
Venetian Village NeighborhoodEstimated Value: $395,000 - $521,000
3
Beds
3
Baths
1,502
Sq Ft
$303/Sq Ft
Est. Value
About This Home
This home is located at 2607 Logan Cir, Colorado Springs, CO 80907 and is currently estimated at $455,825, approximately $303 per square foot. 2607 Logan Cir is a home located in El Paso County with nearby schools including Stratton Elementary School, Mann Middle School, and William J. Palmer High School.
Ownership History
Date
Name
Owned For
Owner Type
Purchase Details
Closed on
Jun 13, 2006
Sold by
Toms Chester A and Lovejoy Charlotte Alice
Bought by
Hollins Cynthia J
Current Estimated Value
Home Financials for this Owner
Home Financials are based on the most recent Mortgage that was taken out on this home.
Original Mortgage
$191,920
Interest Rate
6.58%
Mortgage Type
Fannie Mae Freddie Mac
Purchase Details
Closed on
Dec 12, 2005
Sold by
Richmond Clyde E
Bought by
Toms Chester A and Lovejoy Charlotte Alice
Home Financials for this Owner
Home Financials are based on the most recent Mortgage that was taken out on this home.
Original Mortgage
$175,000
Interest Rate
6.29%
Mortgage Type
Fannie Mae Freddie Mac
Purchase Details
Closed on
Jul 1, 1988
Bought by
Hollins Cynthia J
Purchase Details
Closed on
Apr 1, 1977
Bought by
Hollins Cynthia J
Create a Home Valuation Report for This Property
The Home Valuation Report is an in-depth analysis detailing your home's value as well as a comparison with similar homes in the area
Home Values in the Area
Average Home Value in this Area
Purchase History
| Date | Buyer | Sale Price | Title Company |
|---|---|---|---|
| Hollins Cynthia J | $239,900 | Security Title | |
| Toms Chester A | $235,000 | Security Title | |
| Hollins Cynthia J | -- | -- | |
| Hollins Cynthia J | -- | -- |
Source: Public Records
Mortgage History
| Date | Status | Borrower | Loan Amount |
|---|---|---|---|
| Open | Hollins Cynthia J | $279,000 | |
| Closed | Hollins Cynthia J | $231,525 | |
| Closed | Hollins Cynthia J | $234,500 | |
| Closed | Hollins Cynthia J | $216,000 | |
| Closed | Hollins Cynthia J | $207,327 | |
| Closed | Hollins Cynthia J | $191,920 | |
| Previous Owner | Toms Chester A | $175,000 |
Source: Public Records
Tax History Compared to Growth
Tax History
| Year | Tax Paid | Tax Assessment Tax Assessment Total Assessment is a certain percentage of the fair market value that is determined by local assessors to be the total taxable value of land and additions on the property. | Land | Improvement |
|---|---|---|---|---|
| 2024 | $1,417 | $31,990 | $4,860 | $27,130 |
| 2022 | $1,382 | $24,690 | $4,070 | $20,620 |
| 2021 | $1,498 | $25,390 | $4,180 | $21,210 |
| 2020 | $1,634 | $24,080 | $3,220 | $20,860 |
| 2019 | $1,626 | $24,080 | $3,220 | $20,860 |
| 2018 | $1,458 | $19,870 | $2,120 | $17,750 |
| 2017 | $1,381 | $19,870 | $2,120 | $17,750 |
| 2016 | $1,072 | $18,500 | $1,990 | $16,510 |
| 2015 | $1,068 | $18,500 | $1,990 | $16,510 |
| 2014 | $1,060 | $17,620 | $1,990 | $15,630 |
Source: Public Records
Map
Nearby Homes
- 1412 Seasons Grove
- 2443 Paseo Rd Unit E2
- 2415 N Logan Ave
- 2354 Valley Forge Rd
- 2510 N Union Blvd
- 1313 Pioneer Rd
- 2506 Templeton Gap Rd
- 2814 Virginia Ave
- 3106 Gladiola Dr
- 1241 E Monroe St
- 2518 Jay Place
- 2508 Jay Place
- 916 E La Salle St
- 2524 Meadowlark Ln
- 2112 N Union Blvd
- 2204 Bonfoy Ave
- 2815 N Arcadia St
- 3214 Gladiola Dr
- 2522 Wren Dr
- 2613 Wren Dr