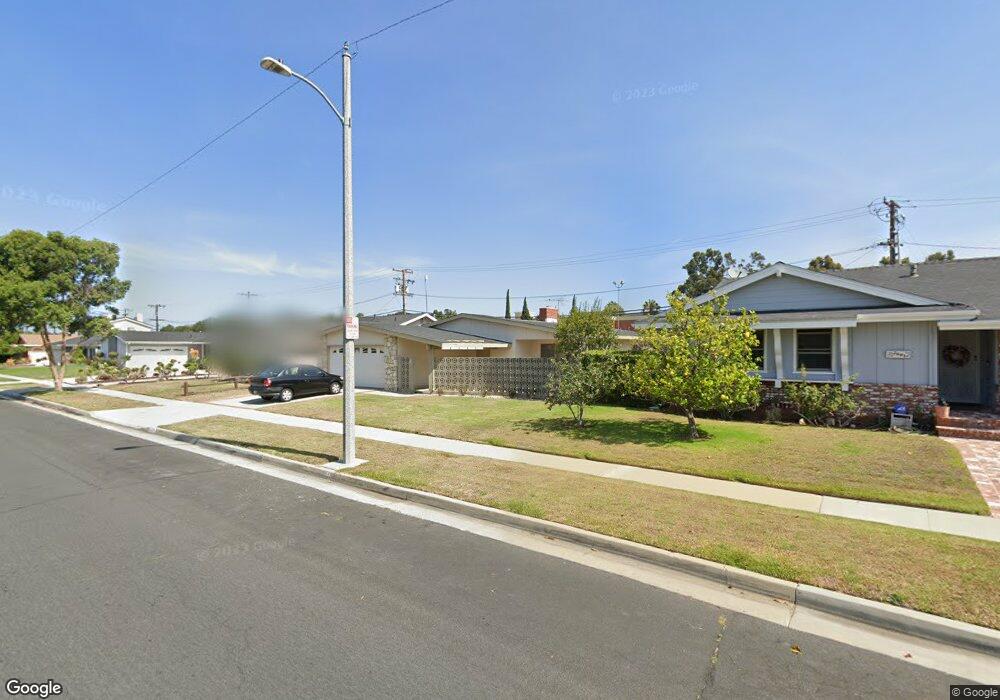
2607 W 225th St Torrance, CA 90505
Southwood Sunray NeighborhoodEstimated Value: $1,190,444 - $1,364,000
3
Beds
2
Baths
1,468
Sq Ft
$894/Sq Ft
Est. Value
About This Home
This home is located at 2607 W 225th St, Torrance, CA 90505 and is currently estimated at $1,312,611, approximately $894 per square foot. 2607 W 225th St is a home located in Los Angeles County with nearby schools including Hickory Elementary School, Madrona Middle School, and Torrance High School.
Ownership History
Date
Name
Owned For
Owner Type
Purchase Details
Closed on
Dec 19, 2003
Sold by
Espinet Jennifer W
Bought by
Espinet Jennifer W S and The Jennifer Espinet Trust
Current Estimated Value
Purchase Details
Closed on
Mar 21, 2001
Sold by
Li Cangpu and Zhang Caiping
Bought by
Espinet Joseph H
Home Financials for this Owner
Home Financials are based on the most recent Mortgage that was taken out on this home.
Original Mortgage
$222,000
Outstanding Balance
$80,595
Interest Rate
6.98%
Estimated Equity
$1,232,016
Purchase Details
Closed on
May 14, 1998
Sold by
Cutshall Robert M and Cutshall Loyzelle R
Bought by
Li Cangpu
Home Financials for this Owner
Home Financials are based on the most recent Mortgage that was taken out on this home.
Original Mortgage
$261,900
Interest Rate
7.17%
Purchase Details
Closed on
Jul 5, 1995
Sold by
Klein Eleanor
Bought by
Cutshall Robert M
Create a Home Valuation Report for This Property
The Home Valuation Report is an in-depth analysis detailing your home's value as well as a comparison with similar homes in the area
Home Values in the Area
Average Home Value in this Area
Purchase History
| Date | Buyer | Sale Price | Title Company |
|---|---|---|---|
| Espinet Jennifer W S | -- | -- | |
| Espinet Joseph H | $380,000 | First American Title Co | |
| Li Cangpu | $291,000 | Southland Title Corporation | |
| Cutshall Robert M | -- | -- |
Source: Public Records
Mortgage History
| Date | Status | Borrower | Loan Amount |
|---|---|---|---|
| Open | Espinet Joseph H | $222,000 | |
| Previous Owner | Li Cangpu | $261,900 |
Source: Public Records
Tax History Compared to Growth
Tax History
| Year | Tax Paid | Tax Assessment Tax Assessment Total Assessment is a certain percentage of the fair market value that is determined by local assessors to be the total taxable value of land and additions on the property. | Land | Improvement |
|---|---|---|---|---|
| 2025 | $6,587 | $572,578 | $458,069 | $114,509 |
| 2024 | $6,587 | $561,352 | $449,088 | $112,264 |
| 2023 | $6,467 | $550,346 | $440,283 | $110,063 |
| 2022 | $6,380 | $539,555 | $431,650 | $107,905 |
| 2021 | $6,261 | $528,977 | $423,187 | $105,790 |
| 2019 | $6,080 | $513,289 | $410,636 | $102,653 |
| 2018 | $5,856 | $503,226 | $402,585 | $100,641 |
| 2016 | $5,591 | $483,687 | $386,953 | $96,734 |
| 2015 | $5,469 | $476,422 | $381,141 | $95,281 |
| 2014 | $5,329 | $467,090 | $373,675 | $93,415 |
Source: Public Records
Map
Nearby Homes
- 2605 Sepulveda Blvd Unit 216
- 2605 Sepulveda Blvd Unit 221
- 22703 Elm Ave
- 2801 Sepulveda Blvd Unit 50
- 2801 Sepulveda Blvd Unit 34
- 2123 Shelburne Way Unit 29
- 2119 Shelburne Way
- 2800 Plaza Del Amo Unit 415
- 2800 Plaza Del Amo Unit 20
- 2800 Plaza Del Amo Unit 92
- 2577 Plaza Del Amo Unit 730
- 2333 W 228th St
- 2559 Plaza Del Amo Unit 207
- 2559 Plaza Del Amo Unit 101
- 2555 Plaza Del Amo Unit R
- 2367 Jefferson St Unit 112
- 2567 Plaza Del Amo Unit 109
- 2571 Plaza Del Amo Unit 310
- 2571 Plaza Del Amo Unit 107
- 2250 Santa fe Ave
- 2613 W 225th St
- 2601 W 225th St
- 2619 W 225th St
- 2610 W 225th St
- 2604 W 225th St
- 2614 W 225th St
- 2625 W 225th St
- 22522 Eriel Ave
- 2600 W 225th St
- 2620 W 225th St
- 22504 Eriel Ave
- 22508 Eriel Ave Unit D
- 22508 Eriel Ave Unit B
- 22508 Eriel Ave
- 2631 W 225th St
- 2626 W 225th St
- 2609 W 226th St
- 22514 Eriel Ave Unit D
- 22514 Eriel Ave Unit A
- 22514 Eriel Ave Unit B