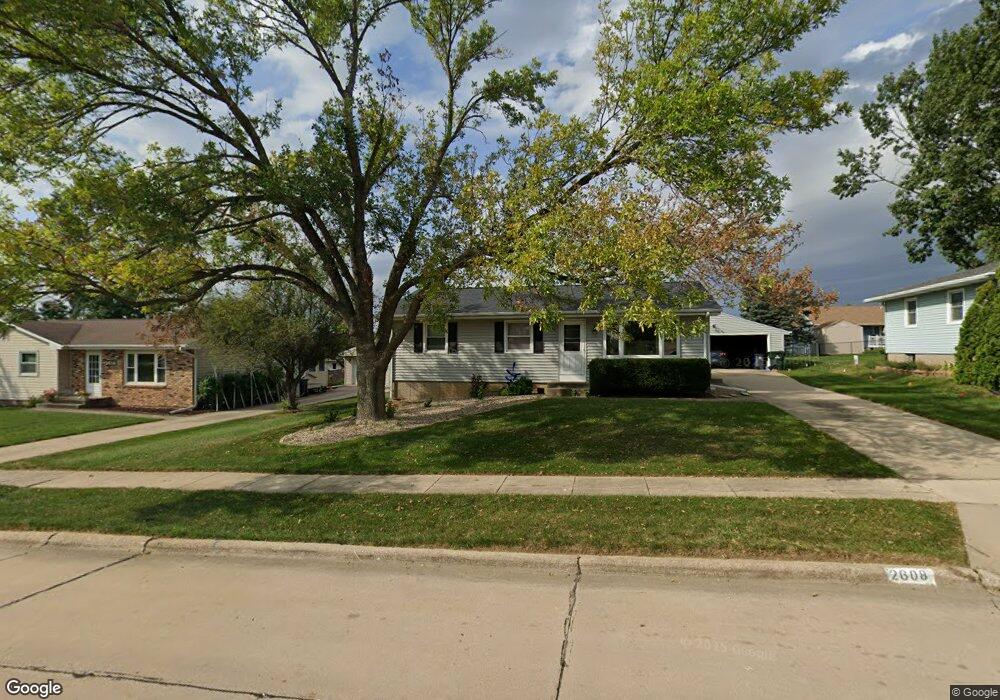
2608 29th St SW Cedar Rapids, IA 52404
Estimated Value: $201,847 - $224,000
3
Beds
2
Baths
1,069
Sq Ft
$200/Sq Ft
Est. Value
About This Home
This home is located at 2608 29th St SW, Cedar Rapids, IA 52404 and is currently estimated at $213,962, approximately $200 per square foot. 2608 29th St SW is a home located in Linn County with nearby schools including Junction City Elementary School, Perryville Elementary School, and Van Buren Elementary School.
Ownership History
Date
Name
Owned For
Owner Type
Purchase Details
Closed on
May 8, 2025
Sold by
John D And Christina K Zielke Trust and Zielke John D
Bought by
Christina K Zielke Trust and Zielke
Current Estimated Value
Purchase Details
Closed on
Nov 28, 2023
Sold by
Zielke Chris
Bought by
John D And Christina K Zielke Trust and Zielke
Purchase Details
Closed on
Feb 10, 2023
Sold by
Brooker Tina M
Bought by
Brooker Tina M and Brooker Robert J
Purchase Details
Closed on
Mar 19, 2020
Sold by
Broker Tina and Zielke Chris
Bought by
Brooker Tina and Zielke Chris
Purchase Details
Closed on
Aug 4, 2017
Sold by
Naaktgeboren Joyce M
Bought by
Naaktgeboren Joyce M and Joyce M Naaktgeboren Trust
Purchase Details
Closed on
Aug 5, 2008
Sold by
Naaktgeboren Charles Lee and Naaktgeboren Joyce M
Bought by
Jirouch Janice M
Purchase Details
Closed on
Jul 21, 2008
Sold by
Atkinson Virginia R and Atkinson James Allen
Bought by
Naaktgeboren Charles Lee and Naaktgeboren Joyce M
Create a Home Valuation Report for This Property
The Home Valuation Report is an in-depth analysis detailing your home's value as well as a comparison with similar homes in the area
Home Values in the Area
Average Home Value in this Area
Purchase History
| Date | Buyer | Sale Price | Title Company |
|---|---|---|---|
| Christina K Zielke Trust | -- | None Listed On Document | |
| Christina K Zielke Trust | -- | None Listed On Document | |
| John D And Christina K Zielke Trust | -- | None Listed On Document | |
| Brooker Tina M | -- | -- | |
| Brooker Tina | -- | None Available | |
| Naaktgeboren Joyce M | -- | None Available | |
| Jirouch Janice M | $132,597 | None Available | |
| Naaktgeboren Charles Lee | $132,000 | None Available |
Source: Public Records
Mortgage History
| Date | Status | Borrower | Loan Amount |
|---|---|---|---|
| Closed | Jirouch Janice M | $0 |
Source: Public Records
Tax History Compared to Growth
Tax History
| Year | Tax Paid | Tax Assessment Tax Assessment Total Assessment is a certain percentage of the fair market value that is determined by local assessors to be the total taxable value of land and additions on the property. | Land | Improvement |
|---|---|---|---|---|
| 2025 | $2,578 | $193,000 | $48,800 | $144,200 |
| 2024 | $3,026 | $182,300 | $41,300 | $141,000 |
| 2023 | $3,026 | $163,100 | $39,400 | $123,700 |
| 2022 | $2,804 | $143,500 | $39,400 | $104,100 |
| 2021 | $2,860 | $135,400 | $35,600 | $99,800 |
| 2020 | $2,860 | $129,600 | $30,000 | $99,600 |
| 2019 | $2,588 | $120,100 | $30,000 | $90,100 |
| 2018 | $2,518 | $120,100 | $30,000 | $90,100 |
| 2017 | $2,391 | $115,800 | $30,000 | $85,800 |
| 2016 | $2,391 | $115,800 | $30,000 | $85,800 |
| 2015 | $2,491 | $120,421 | $30,000 | $90,421 |
| 2014 | $2,306 | $120,421 | $30,000 | $90,421 |
| 2013 | $2,250 | $120,421 | $30,000 | $90,421 |
Source: Public Records
Map
Nearby Homes
- 2812 29th Ave SW
- 3009 Carriage Dr SW
- 3000 Wilson Ave SW Unit A11
- 3000 Wilson Ave SW
- 3108 Huxley Ln SW
- 3132 Pebble Dr SW
- 3212 Wilson Ave SW
- 3139 Stratford Ln SW
- 3140 Wilson Ave SW Unit 6
- 3221 Bramble Rd SW
- 3150 Wilson Ave SW Unit H10
- 3150 Wilson Ave SW Unit 7
- 2020 25th St SW
- 3205 33rd Ave SW
- 2521 Radcliffe Ct SW
- 0 Williams Blvd SW
- 2404 25th St SW
- 3405 Queen Dr SW
- 2126 Snapdragon Cir SW
- 3302 Sokol Ln SW
- 2614 29th St SW
- 2602 29th St SW
- 2611 30th St SW
- 2617 30th St SW
- 2620 29th St SW
- 2605 30th St SW
- 2534 29th St SW
- 2625 30th St SW
- 2535 30th St SW
- 2528 29th St SW
- 2531 30th St SW
- 2705 30th St SW
- 2522 29th St SW
- 2610 30th St SW
- 2704 29th St SW
- 2600 30th St SW
- 2624 30th St SW
- 2521 30th St SW
- 2701 29th St SW
- 2542 30th St SW