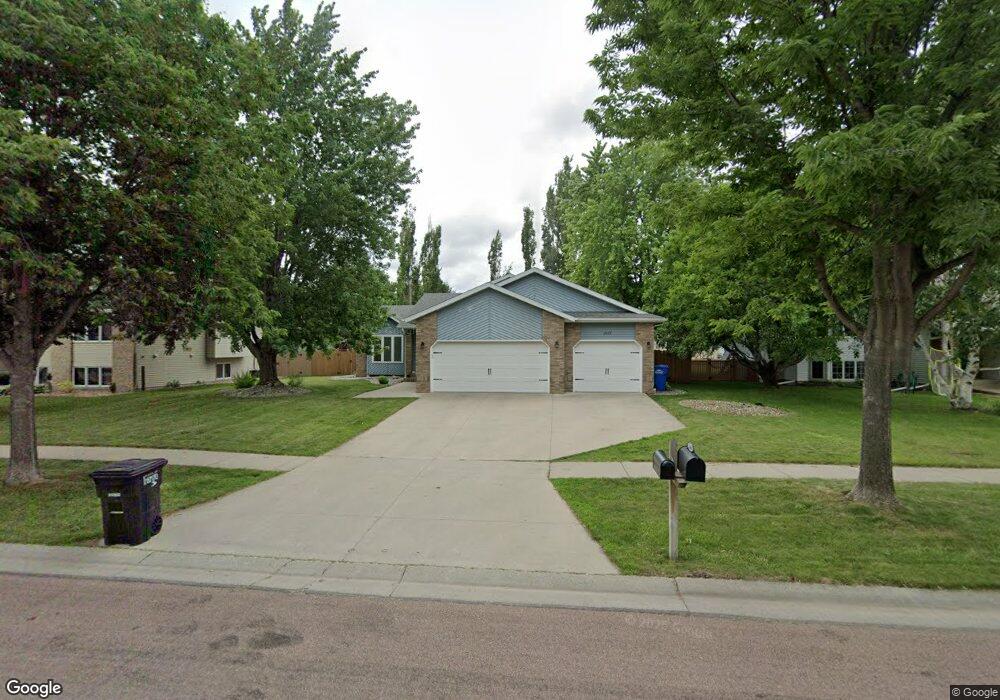
2608 38 1/2 Ave S Fargo, ND 58104
Stonebridge NeighborhoodEstimated Value: $405,000 - $433,000
4
Beds
3
Baths
2,522
Sq Ft
$167/Sq Ft
Est. Value
About This Home
This home is located at 2608 38 1/2 Ave S, Fargo, ND 58104 and is currently estimated at $420,020, approximately $166 per square foot. 2608 38 1/2 Ave S is a home located in Cass County with nearby schools including Centennial Elementary School, Discovery Middle School, and Fargo Davies High School.
Ownership History
Date
Name
Owned For
Owner Type
Purchase Details
Closed on
Jan 5, 2021
Sold by
Betterman Lucas R and Betterman Chelsea J
Bought by
Montplaisir Darin C and Montplaisir Bethany K
Current Estimated Value
Home Financials for this Owner
Home Financials are based on the most recent Mortgage that was taken out on this home.
Original Mortgage
$274,000
Outstanding Balance
$245,622
Interest Rate
2.7%
Mortgage Type
New Conventional
Estimated Equity
$174,606
Purchase Details
Closed on
Mar 29, 2017
Sold by
Pender Kyle G
Bought by
Betterman Lucas R and Betterman Cheslsea J
Home Financials for this Owner
Home Financials are based on the most recent Mortgage that was taken out on this home.
Original Mortgage
$123,000
Interest Rate
4.1%
Mortgage Type
Commercial
Purchase Details
Closed on
Nov 19, 2009
Sold by
Busek Kent A and Busek Corrine L
Bought by
Pender Kyle G
Home Financials for this Owner
Home Financials are based on the most recent Mortgage that was taken out on this home.
Original Mortgage
$195,000
Interest Rate
4.9%
Mortgage Type
Purchase Money Mortgage
Create a Home Valuation Report for This Property
The Home Valuation Report is an in-depth analysis detailing your home's value as well as a comparison with similar homes in the area
Home Values in the Area
Average Home Value in this Area
Purchase History
| Date | Buyer | Sale Price | Title Company |
|---|---|---|---|
| Montplaisir Darin C | $342,900 | The Title Co Residential | |
| Betterman Lucas R | $271,500 | Title Co | |
| Pender Kyle G | -- | -- |
Source: Public Records
Mortgage History
| Date | Status | Borrower | Loan Amount |
|---|---|---|---|
| Open | Montplaisir Darin C | $274,000 | |
| Previous Owner | Betterman Lucas R | $2 | |
| Previous Owner | Pender Kyle G | $195,000 |
Source: Public Records
Tax History Compared to Growth
Tax History
| Year | Tax Paid | Tax Assessment Tax Assessment Total Assessment is a certain percentage of the fair market value that is determined by local assessors to be the total taxable value of land and additions on the property. | Land | Improvement |
|---|---|---|---|---|
| 2024 | $4,602 | $181,350 | $36,000 | $145,350 |
| 2023 | $4,824 | $172,700 | $36,000 | $136,700 |
| 2022 | $4,222 | $147,800 | $37,750 | $110,050 |
| 2021 | $3,807 | $134,350 | $37,750 | $96,600 |
| 2020 | $3,787 | $134,350 | $37,750 | $96,600 |
| 2019 | $3,790 | $134,350 | $23,600 | $110,750 |
| 2018 | $3,722 | $134,350 | $23,600 | $110,750 |
| 2017 | $3,689 | $134,350 | $23,600 | $110,750 |
| 2016 | $3,304 | $130,550 | $23,600 | $106,950 |
| 2015 | $3,091 | $118,700 | $16,050 | $102,650 |
| 2014 | $2,972 | $107,900 | $16,050 | $91,850 |
| 2013 | $2,841 | $102,750 | $16,050 | $86,700 |
Source: Public Records
Map
Nearby Homes
- 2608 38 1 2 Ave S
- 2602 38 1 2 Ave S
- 2602 38 1/2 Ave S
- 2616 38 1/2 Ave S
- 2616 38 1 2 Ave S
- 2609 39th Ave SW
- 2609 39th Ave S
- 2617 39th Ave S
- 2624 38 1 2 Ave S
- 2601 39th Ave S
- 2524 38 1/2 Ave S
- 2624 38 1/2 Ave S
- 2609 38 1 2 Ave S
- 2609 38 1/2 Ave S
- 2625 39th Ave S
- 2617 38 1/2 Ave S
- 2601 38 1 2 Ave S
- 2601 38 1/2 Ave S
- 2525 39th Ave S
- 2525 39th Ave SW