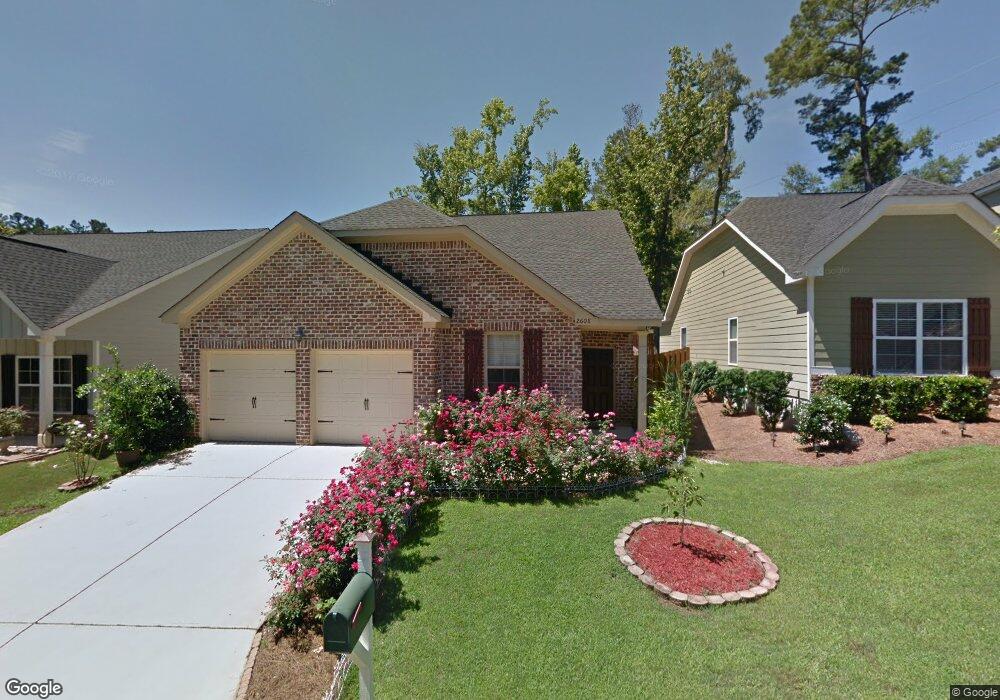
2608 Sherborne Ct Augusta, GA 30909
West Augusta NeighborhoodEstimated Value: $308,253 - $334,000
3
Beds
3
Baths
1,865
Sq Ft
$175/Sq Ft
Est. Value
About This Home
This home is located at 2608 Sherborne Ct, Augusta, GA 30909 and is currently estimated at $326,063, approximately $174 per square foot. 2608 Sherborne Ct is a home located in Richmond County with nearby schools including First Coast Technical Institute, A. Brian Merry Elementary School, and Tutt Middle School.
Ownership History
Date
Name
Owned For
Owner Type
Purchase Details
Closed on
Aug 18, 2021
Sold by
Oshea Cathleen M
Bought by
Oshea Cathleen M and Savir Nathan
Current Estimated Value
Purchase Details
Closed on
May 10, 2021
Sold by
Tolar Joseph R
Bought by
Oshea Cathleen M
Home Financials for this Owner
Home Financials are based on the most recent Mortgage that was taken out on this home.
Original Mortgage
$186,400
Interest Rate
3.1%
Mortgage Type
New Conventional
Purchase Details
Closed on
Feb 23, 2012
Sold by
Jj & Z Builders Llc
Bought by
Tolar Joseph R
Home Financials for this Owner
Home Financials are based on the most recent Mortgage that was taken out on this home.
Original Mortgage
$148,048
Interest Rate
3.62%
Mortgage Type
FHA
Purchase Details
Closed on
Feb 28, 2011
Sold by
Cotswold-Augusta Llc
Bought by
Jj & Z Builders Llc
Create a Home Valuation Report for This Property
The Home Valuation Report is an in-depth analysis detailing your home's value as well as a comparison with similar homes in the area
Home Values in the Area
Average Home Value in this Area
Purchase History
| Date | Buyer | Sale Price | Title Company |
|---|---|---|---|
| Oshea Cathleen M | -- | -- | |
| Oshea Cathleen M | $233,000 | -- | |
| Tolar Joseph R | $151,900 | -- | |
| Jj & Z Builders Llc | $41,500 | -- |
Source: Public Records
Mortgage History
| Date | Status | Borrower | Loan Amount |
|---|---|---|---|
| Previous Owner | Oshea Cathleen M | $186,400 | |
| Previous Owner | Tolar Joseph R | $148,048 |
Source: Public Records
Tax History Compared to Growth
Tax History
| Year | Tax Paid | Tax Assessment Tax Assessment Total Assessment is a certain percentage of the fair market value that is determined by local assessors to be the total taxable value of land and additions on the property. | Land | Improvement |
|---|---|---|---|---|
| 2025 | $3,894 | $132,400 | $20,000 | $112,400 |
| 2024 | $3,894 | $120,984 | $20,000 | $100,984 |
| 2023 | $3,637 | $101,580 | $20,000 | $81,580 |
| 2022 | $2,898 | $89,355 | $20,000 | $69,355 |
| 2021 | $3,160 | $89,936 | $20,000 | $69,936 |
| 2020 | $2,717 | $76,984 | $20,000 | $56,984 |
| 2019 | $2,886 | $76,984 | $20,000 | $56,984 |
| 2018 | $2,907 | $76,984 | $20,000 | $56,984 |
| 2017 | $2,414 | $63,837 | $20,000 | $43,837 |
| 2016 | $2,416 | $63,837 | $20,000 | $43,837 |
| 2015 | $2,433 | $63,837 | $20,000 | $43,837 |
| 2014 | $2,436 | $63,837 | $20,000 | $43,837 |
Source: Public Records
Map
Nearby Homes
- 2614 Sherborne Ct
- 2609 Sherborne Ct
- 2918 Arrowhead Dr
- 2901 Sussex Rd
- 3007 Pointewest Dr
- 2413 Woodbluff Ct
- 2920 Sussex Rd
- 2908 Stratford Dr
- 417 Ashland Dr
- 2507 Pinebluff Ct
- 2703 Oakbluff Ct
- 2924 Mayfair Ct
- 104 York Way
- 2695 York Dr
- 503 Sheffield Dr
- 427 Aumond Rd
- 3084 Westwood Rd
- 3082 Westwood Rd
- 3086 Westwood Rd
- 2610 Sherborne Ct
- 2606 Sherborne Ct
- 2612 Sherborne Ct
- 2604 Sherborne Ct
- 2613 Sherborne Ct
- 2611 Sherborne Ct
- 2607 Sherborne Ct
- 2616 Sherborne Ct
- 2605 Sherborne Ct
- 2603 Sherborne Ct
- 2618 Sherborne Ct
- 2620 Sherborne Ct
- 2622 Sherborne Ct
- 2624 Sherborne Ct
- 2905 Arrowhead Dr
- 2905 Arrowhead Dr Unit L4
- 2905 Arrowhead Dr
- 2902 Westchester Dr Unit 4
- 2906 Arrowhead Dr
- 2904 Arrowhead Dr