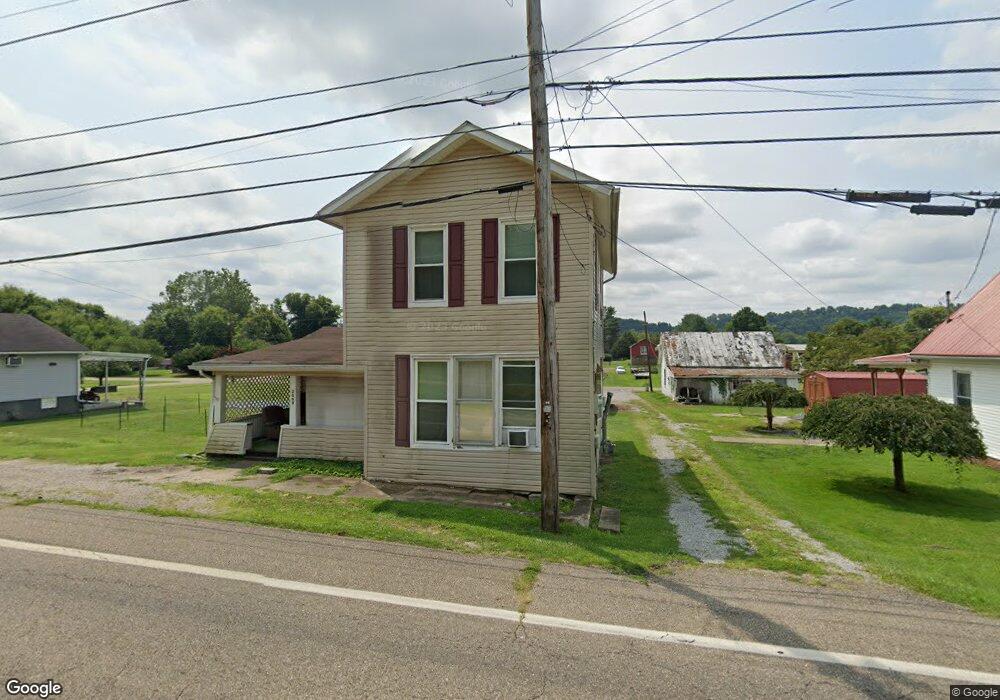
2609 3rd St Syracuse, OH 45779
Estimated Value: $49,446 - $153,000
Studio
--
Bath
1,170
Sq Ft
$93/Sq Ft
Est. Value
About This Home
This home is located at 2609 3rd St, Syracuse, OH 45779 and is currently estimated at $108,862, approximately $93 per square foot. 2609 3rd St is a home.
Ownership History
Date
Name
Owned For
Owner Type
Purchase Details
Closed on
Nov 20, 2020
Sold by
Willis Robert O
Bought by
Cook Nathaniel A and Cook Lee Anna
Current Estimated Value
Home Financials for this Owner
Home Financials are based on the most recent Mortgage that was taken out on this home.
Original Mortgage
$58,100
Outstanding Balance
$51,227
Interest Rate
2.8%
Mortgage Type
New Conventional
Estimated Equity
$57,635
Purchase Details
Closed on
Nov 17, 2014
Sold by
Riffle James A and Riffle Virginia R
Bought by
Willis Robert O
Home Financials for this Owner
Home Financials are based on the most recent Mortgage that was taken out on this home.
Original Mortgage
$56,000
Interest Rate
4%
Mortgage Type
Adjustable Rate Mortgage/ARM
Create a Home Valuation Report for This Property
The Home Valuation Report is an in-depth analysis detailing your home's value as well as a comparison with similar homes in the area
Purchase History
| Date | Buyer | Sale Price | Title Company |
|---|---|---|---|
| Cook Nathaniel A | $60,000 | Northwest Ttl Fam Of Compani | |
| Willis Robert O | $60,000 | None Available |
Source: Public Records
Mortgage History
| Date | Status | Borrower | Loan Amount |
|---|---|---|---|
| Open | Cook Nathaniel A | $58,100 | |
| Previous Owner | Willis Robert O | $56,000 |
Source: Public Records
Tax History
| Year | Tax Paid | Tax Assessment Tax Assessment Total Assessment is a certain percentage of the fair market value that is determined by local assessors to be the total taxable value of land and additions on the property. | Land | Improvement |
|---|---|---|---|---|
| 2024 | $681 | $14,690 | $3,340 | $11,350 |
| 2023 | $571 | $14,690 | $3,340 | $11,350 |
| 2022 | $565 | $14,690 | $3,340 | $11,350 |
| 2021 | $1,013 | $11,150 | $2,580 | $8,570 |
| 2020 | $521 | $11,150 | $2,580 | $8,570 |
| 2019 | $521 | $11,150 | $2,580 | $8,570 |
| 2018 | $475 | $10,040 | $1,720 | $8,320 |
| 2017 | $475 | $10,040 | $1,720 | $8,320 |
| 2016 | $471 | $10,040 | $1,720 | $8,320 |
| 2014 | $173 | $12,790 | $1,560 | $11,230 |
| 2013 | $173 | $12,790 | $1,560 | $11,230 |
Source: Public Records
Map
Nearby Homes
Your Personal Tour Guide
Ask me questions while you tour the home.