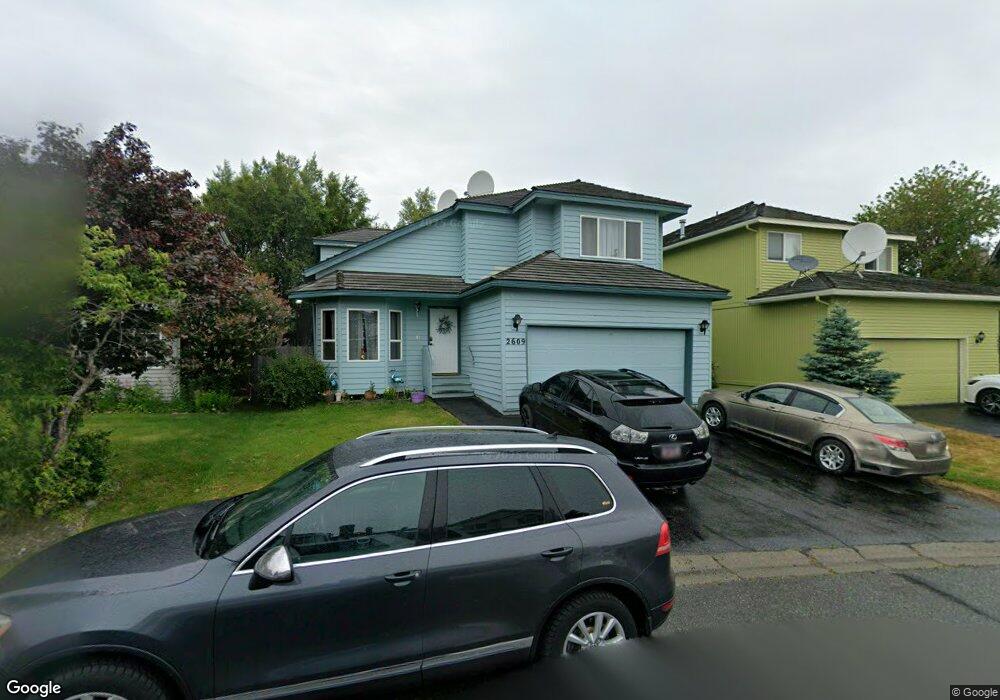
2609 Brookstone Loop Anchorage, AK 99515
Bayshore-Klatt NeighborhoodEstimated Value: $388,000 - $564,000
3
Beds
3
Baths
1,720
Sq Ft
$267/Sq Ft
Est. Value
About This Home
This home is located at 2609 Brookstone Loop, Anchorage, AK 99515 and is currently estimated at $458,419, approximately $266 per square foot. 2609 Brookstone Loop is a home located in Anchorage Municipality with nearby schools including Klatt Elementary School, Goldenview Middle School, and South Anchorage High School.
Ownership History
Date
Name
Owned For
Owner Type
Purchase Details
Closed on
May 2, 2023
Sold by
Bickford Francis Xavier
Bought by
Lucero Norma Maria
Current Estimated Value
Purchase Details
Closed on
May 19, 2021
Sold by
Fregly Joan
Bought by
Fregly Terrance and Fregly Ashley Sarah
Home Financials for this Owner
Home Financials are based on the most recent Mortgage that was taken out on this home.
Original Mortgage
$194,600
Interest Rate
2.9%
Mortgage Type
New Conventional
Purchase Details
Closed on
Mar 3, 2010
Sold by
Mendoza Juan Carlos
Bought by
Lucero Norma Maria
Purchase Details
Closed on
Jun 11, 2004
Sold by
Guyer Paul Scott and Guyer Lori Anne
Bought by
Mendoza Juan C and Lucero Norma M
Home Financials for this Owner
Home Financials are based on the most recent Mortgage that was taken out on this home.
Original Mortgage
$254,120
Interest Rate
5.99%
Mortgage Type
Purchase Money Mortgage
Purchase Details
Closed on
Mar 26, 1996
Sold by
Hultquist Construction Inc
Bought by
Guyer Paul Scott
Home Financials for this Owner
Home Financials are based on the most recent Mortgage that was taken out on this home.
Original Mortgage
$137,300
Interest Rate
6.98%
Mortgage Type
New Conventional
Create a Home Valuation Report for This Property
The Home Valuation Report is an in-depth analysis detailing your home's value as well as a comparison with similar homes in the area
Home Values in the Area
Average Home Value in this Area
Purchase History
| Date | Buyer | Sale Price | Title Company |
|---|---|---|---|
| Lucero Norma Maria | -- | None Listed On Document | |
| Fregly Terrance | -- | None Listed On Document | |
| Lucero Norma Maria | -- | None Available | |
| Mendoza Juan C | -- | -- | |
| Guyer Paul Scott | -- | -- |
Source: Public Records
Mortgage History
| Date | Status | Borrower | Loan Amount |
|---|---|---|---|
| Previous Owner | Fregly Terrance | $194,600 | |
| Previous Owner | Mendoza Juan C | $254,120 | |
| Previous Owner | Guyer Paul Scott | $137,300 |
Source: Public Records
Tax History
| Year | Tax Paid | Tax Assessment Tax Assessment Total Assessment is a certain percentage of the fair market value that is determined by local assessors to be the total taxable value of land and additions on the property. | Land | Improvement |
|---|---|---|---|---|
| 2025 | $6,917 | $448,700 | $102,300 | $346,400 |
| 2024 | $6,917 | $428,400 | $90,600 | $337,800 |
| 2023 | $6,562 | $385,300 | $87,200 | $298,100 |
| 2022 | $6,455 | $383,300 | $87,200 | $296,100 |
| 2021 | $6,224 | $345,400 | $87,200 | $258,200 |
| 2020 | $6,008 | $353,400 | $87,200 | $266,200 |
| 2019 | $5,844 | $357,200 | $87,200 | $270,000 |
| 2018 | $5,571 | $339,700 | $87,200 | $252,500 |
| 2017 | $5,331 | $340,400 | $87,200 | $253,200 |
| 2016 | $4,992 | $349,400 | $87,200 | $262,200 |
| 2015 | $4,992 | $357,800 | $88,300 | $269,500 |
| 2014 | $4,992 | $340,300 | $91,900 | $248,400 |
Source: Public Records
Map
Nearby Homes
- 11500 Jennifer Ann Cir
- 2005 Casey Cusack Loop
- 10935 Northfleet Dr
- 1850 Vashon Cir
- 3099 Seclusion Cove Dr Unit 24
- 3121 Marathon Cir
- 2356 Leander Cir
- L8 B8 Spartan Dr
- 1030 Allison Cir
- 3017 Bettles Bay Loop
- 10254 Goodnews Cir
- 10205 Goodnews Cir
- 10545 Vancouver Cir
- 10121 Goodnews Ln
- 3101 Bettles Bay Loop
- 3511 Amber Bay Loop
- L27 B2 Laurel Acres
- 10031 Zeus Cir
- 10040 Zeus Cir
- 9520 Albatross Dr
- 2615 Brookstone Loop
- 2605 Brookstone Loop
- 2623 Brookstone Loop
- 2601 Brookstone Loop
- 2608 Brookstone Loop
- 2616 Brookstone Loop
- 2631 Brookstone Loop
- 11721 Clerke Cir
- 2624 Brookstone Loop
- 11711 Clerke Cir
- 2632 Brookstone Loop
- 2637 Brookstone Loop
- 2705 Diligence Cir
- 2563 Brookstone Loop
- 2557 Brookstone Loop
- 2644 Brookstone Loop
- 2542 Brookstone Loop
- 2725 Diligence Cir
- 2551 Brookstone Loop
- 11702 Clerke Cir
Your Personal Tour Guide
Ask me questions while you tour the home.