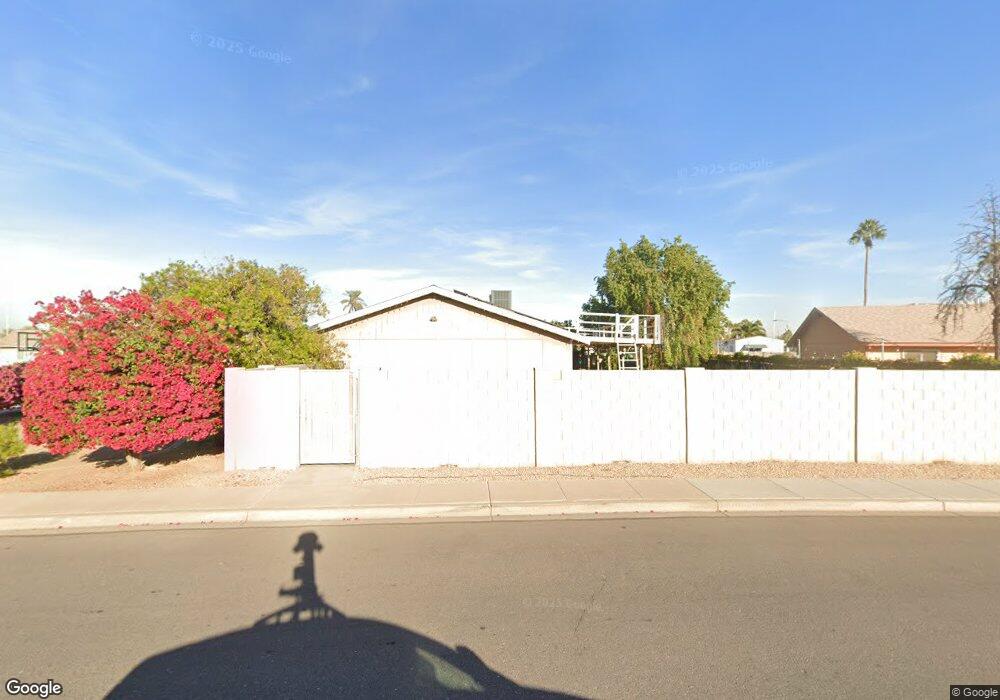
2609 E Commonwealth Cir Unit SHARP Chandler, AZ 85225
East Chandler NeighborhoodEstimated Value: $407,360 - $442,000
3
Beds
2
Baths
1,268
Sq Ft
$333/Sq Ft
Est. Value
About This Home
This home is located at 2609 E Commonwealth Cir Unit SHARP, Chandler, AZ 85225 and is currently estimated at $421,840, approximately $332 per square foot. 2609 E Commonwealth Cir Unit SHARP is a home located in Maricopa County with nearby schools including Chandler Traditional Academy-Humphrey, Willis Junior High School, and Imagine West Gilbert Elementary School.
Ownership History
Date
Name
Owned For
Owner Type
Purchase Details
Closed on
Aug 17, 2017
Sold by
Vineyard Commonwealth Llc
Bought by
Mcdaid Peter H and Mcdaid Keli
Current Estimated Value
Home Financials for this Owner
Home Financials are based on the most recent Mortgage that was taken out on this home.
Original Mortgage
$208,680
Outstanding Balance
$174,127
Interest Rate
3.96%
Mortgage Type
New Conventional
Estimated Equity
$247,713
Purchase Details
Closed on
Dec 3, 2009
Sold by
Merrell Mark A
Bought by
Vineyard Commonwealth Llc
Purchase Details
Closed on
Jun 10, 2003
Sold by
Martin Francis and Martin Kimberly Lee
Bought by
Merrell Mark A
Home Financials for this Owner
Home Financials are based on the most recent Mortgage that was taken out on this home.
Original Mortgage
$119,500
Interest Rate
5.26%
Mortgage Type
New Conventional
Create a Home Valuation Report for This Property
The Home Valuation Report is an in-depth analysis detailing your home's value as well as a comparison with similar homes in the area
Home Values in the Area
Average Home Value in this Area
Purchase History
| Date | Buyer | Sale Price | Title Company |
|---|---|---|---|
| Mcdaid Peter H | $222,000 | Security Title Agency Inc | |
| Vineyard Commonwealth Llc | -- | None Available | |
| Merrell Mark A | $133,000 | Fidelity National Title |
Source: Public Records
Mortgage History
| Date | Status | Borrower | Loan Amount |
|---|---|---|---|
| Open | Mcdaid Peter H | $208,680 | |
| Previous Owner | Merrell Mark A | $119,500 |
Source: Public Records
Tax History
| Year | Tax Paid | Tax Assessment Tax Assessment Total Assessment is a certain percentage of the fair market value that is determined by local assessors to be the total taxable value of land and additions on the property. | Land | Improvement |
|---|---|---|---|---|
| 2025 | $1,104 | $14,167 | -- | -- |
| 2024 | $1,066 | $13,492 | -- | -- |
| 2023 | $1,066 | $29,530 | $5,900 | $23,630 |
| 2022 | $1,028 | $22,160 | $4,430 | $17,730 |
| 2021 | $1,078 | $21,120 | $4,220 | $16,900 |
| 2020 | $1,073 | $19,070 | $3,810 | $15,260 |
| 2019 | $1,032 | $16,910 | $3,380 | $13,530 |
| 2018 | $999 | $15,060 | $3,010 | $12,050 |
| 2017 | $1,115 | $13,450 | $2,690 | $10,760 |
| 2016 | $1,077 | $12,630 | $2,520 | $10,110 |
| 2015 | $1,032 | $11,720 | $2,340 | $9,380 |
Source: Public Records
Map
Nearby Homes
- 2573 E Commonwealth Cir
- 252 N Wilson Dr
- 15606 S Gilbert Rd Unit 109
- 15606 S Gilbert Rd Unit 63
- 15802 S Gilbert Rd Unit 120
- 13402 E Boston St
- 2691 E Hulet Dr
- 2860 E Detroit St
- 384 N Scott Dr
- 2480 E Stephens Place
- 2720 E Carla Vista Dr
- 2 S 130th Place
- 25 N Cottonwood St Unit 47
- 25 N Cottonwood St Unit 59
- 195 N Cottonwood St Unit 21
- 562 N Kimberlee Way
- 2721 E Folley Place
- 2230 E Frye Rd
- 28 E Joseph Way
- 42 E Joseph Way
- 2609 E Commonwealth Cir
- 2613 E Commonwealth Cir
- 2605 E Commonwealth Cir
- 2604 E Commonwealth Cir
- 2601 E Commonwealth Cir
- 2624 E Commonwealth Cir
- 2625 E Commonwealth Cir
- 2600 E Commonwealth Cir
- 2621 E Commonwealth Cir
- 2628 E Commonwealth Cir
- 2597 E Commonwealth Cir
- 2571 E Coronita Cir
- 2596 E Commonwealth Cir
- 2629 E Commonwealth Cir
- 2759 E Chandler Blvd
- 2567 E Coronita Cir
- 2632 E Commonwealth Cir
- 2592 E Commonwealth Cir
- 2579 E Coronita Cir
- 2633 E Commonwealth Cir
Your Personal Tour Guide
Ask me questions while you tour the home.