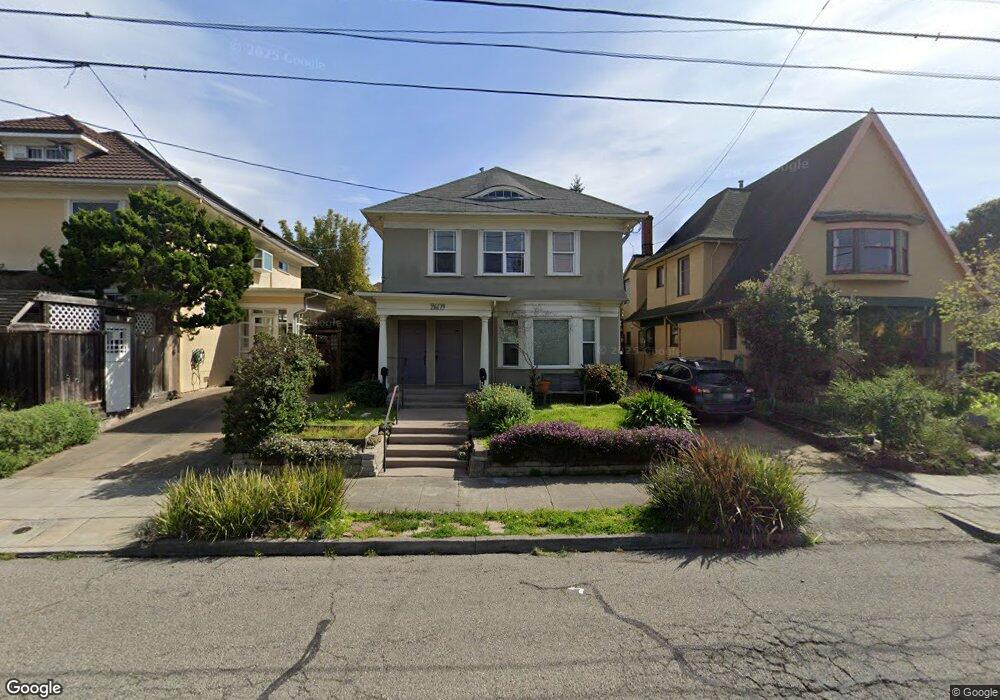
2609 Grant St Berkeley, CA 94703
South Berkeley NeighborhoodEstimated Value: $1,187,000 - $1,759,061
3
Beds
2
Baths
2,305
Sq Ft
$693/Sq Ft
Est. Value
About This Home
This home is located at 2609 Grant St, Berkeley, CA 94703 and is currently estimated at $1,596,765, approximately $692 per square foot. 2609 Grant St is a home located in Alameda County with nearby schools including Malcolm X Elementary School, Emerson Elementary School, and John Muir Elementary School.
Ownership History
Date
Name
Owned For
Owner Type
Purchase Details
Closed on
Dec 3, 2012
Sold by
Godfredsen Karen
Bought by
Crockett Timothy and Godfredsen Karen
Current Estimated Value
Purchase Details
Closed on
Jan 24, 2011
Sold by
Teek Morag Anne
Bought by
Godfredsen Karen
Purchase Details
Closed on
Aug 17, 2009
Sold by
Margen David
Bought by
Godfredsen Karen and Teek Morag Anne
Home Financials for this Owner
Home Financials are based on the most recent Mortgage that was taken out on this home.
Original Mortgage
$381,500
Interest Rate
5.19%
Mortgage Type
New Conventional
Purchase Details
Closed on
Aug 11, 2009
Sold by
Crockett Timothy Dale
Bought by
Godfredsen Karen
Home Financials for this Owner
Home Financials are based on the most recent Mortgage that was taken out on this home.
Original Mortgage
$381,500
Interest Rate
5.19%
Mortgage Type
New Conventional
Purchase Details
Closed on
Mar 12, 2004
Sold by
Tyler Aikens Ester Lee
Bought by
Matha Rafael
Home Financials for this Owner
Home Financials are based on the most recent Mortgage that was taken out on this home.
Original Mortgage
$356,000
Interest Rate
5.75%
Mortgage Type
Purchase Money Mortgage
Purchase Details
Closed on
Jun 14, 2002
Sold by
Tyler Aikens Ester Lee and Aikens Ester Lee
Bought by
Tyler Aikens Ester Lee
Home Financials for this Owner
Home Financials are based on the most recent Mortgage that was taken out on this home.
Original Mortgage
$280,000
Interest Rate
6.86%
Create a Home Valuation Report for This Property
The Home Valuation Report is an in-depth analysis detailing your home's value as well as a comparison with similar homes in the area
Home Values in the Area
Average Home Value in this Area
Purchase History
| Date | Buyer | Sale Price | Title Company |
|---|---|---|---|
| Crockett Timothy | -- | None Available | |
| Godfredsen Karen | -- | None Available | |
| Godfredsen Karen | $707,000 | Old Republic Title Company | |
| Godfredsen Karen | -- | Old Republic Title Company | |
| Matha Rafael | $445,000 | Chicago Title Company | |
| Tyler Aikens Ester Lee | -- | -- |
Source: Public Records
Mortgage History
| Date | Status | Borrower | Loan Amount |
|---|---|---|---|
| Previous Owner | Godfredsen Karen | $381,500 | |
| Previous Owner | Matha Rafael | $356,000 | |
| Previous Owner | Tyler Aikens Ester Lee | $280,000 | |
| Closed | Matha Rafael | $44,500 |
Source: Public Records
Tax History
| Year | Tax Paid | Tax Assessment Tax Assessment Total Assessment is a certain percentage of the fair market value that is determined by local assessors to be the total taxable value of land and additions on the property. | Land | Improvement |
|---|---|---|---|---|
| 2025 | $15,533 | $972,112 | $273,763 | $705,349 |
| 2024 | $15,533 | $952,920 | $268,397 | $691,523 |
| 2023 | $15,204 | $941,101 | $263,135 | $677,966 |
| 2022 | $14,916 | $915,652 | $257,977 | $664,675 |
| 2021 | $14,941 | $897,567 | $252,920 | $651,647 |
| 2020 | $14,094 | $895,297 | $250,328 | $644,969 |
| 2019 | $13,492 | $877,744 | $245,420 | $632,324 |
| 2018 | $13,258 | $860,540 | $240,610 | $619,930 |
| 2017 | $12,794 | $843,670 | $235,893 | $607,777 |
| 2016 | $12,356 | $827,132 | $231,269 | $595,863 |
| 2015 | $12,188 | $814,714 | $227,797 | $586,917 |
| 2014 | $12,180 | $798,762 | $223,337 | $575,425 |
Source: Public Records
Map
Nearby Homes
- 1901 Parker St Unit 3
- 2701 Grant St
- 1645 Dwight Way
- 1612 Parker St
- 1612 Carleton St
- 2018 Blake St
- 1515 Derby St
- 1530 Stuart St
- 2750 Sacramento St
- 1450 Ward St
- 2758 Sacramento St
- 2774 Sacramento St
- 2926 Ellis St
- 2782 Sacramento St
- 2790 Sacramento St
- 2350 Sacramento St
- 1535 Julia St
- 2218 -2222 Grant St
- 1646 Ashby Ave
- 2057 Emerson St
- 2607 Grant St
- 2611 Grant St
- 2601 Grant St
- 1810 Parker St
- 1812 Parker St
- 1801 Carleton St
- 1807 Carleton St
- 1814 Parker St Unit A
- 1814 Parker St Unit B
- 2608 Grant St
- 1818 Parker St
- 2604 Grant St
- 2610 Grant St
- 2612 Grant St
- 1817 Carleton St
- 2600 Grant St
- 1817 Carleton St C
- 2543 Grant St
- 1739 Carleton St
- 2544 Grant St
Your Personal Tour Guide
Ask me questions while you tour the home.