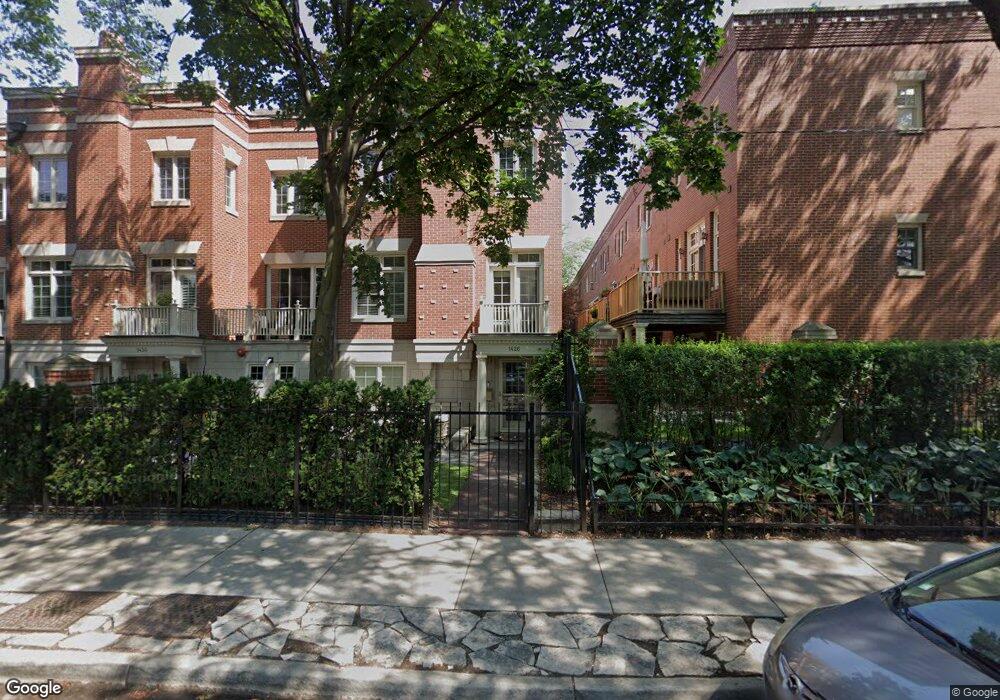
2609 N Greenview Ave Chicago, IL 60614
West DePaul NeighborhoodEstimated Value: $1,121,000 - $1,346,000
3
Beds
3
Baths
2,643
Sq Ft
$470/Sq Ft
Est. Value
About This Home
This home is located at 2609 N Greenview Ave, Chicago, IL 60614 and is currently estimated at $1,242,877, approximately $470 per square foot. 2609 N Greenview Ave is a home located in Cook County with nearby schools including Prescott Elementary School, Lincoln Park High School, and St Josaphat School.
Ownership History
Date
Name
Owned For
Owner Type
Purchase Details
Closed on
Feb 28, 2022
Sold by
Loventhal Robert D
Bought by
Us Bank Na
Current Estimated Value
Purchase Details
Closed on
Feb 9, 2022
Sold by
Loventhal Robert D
Bought by
Us Bank Na
Purchase Details
Closed on
Feb 5, 2009
Sold by
Loventhal Robert and Loventhal Deborah
Bought by
Loventhal Deborah
Purchase Details
Closed on
Jul 26, 2005
Sold by
Ovca Cherilyn
Bought by
Loventhal Robert and Loventhal Deborah
Home Financials for this Owner
Home Financials are based on the most recent Mortgage that was taken out on this home.
Original Mortgage
$712,500
Interest Rate
5.08%
Mortgage Type
Unknown
Purchase Details
Closed on
Jun 23, 1999
Sold by
Ovca William F
Bought by
Ovca Cherilyn
Purchase Details
Closed on
Jul 8, 1997
Sold by
Ovca William F
Bought by
Ovca Charilyn
Create a Home Valuation Report for This Property
The Home Valuation Report is an in-depth analysis detailing your home's value as well as a comparison with similar homes in the area
Home Values in the Area
Average Home Value in this Area
Purchase History
| Date | Buyer | Sale Price | Title Company |
|---|---|---|---|
| Us Bank Na | -- | -- | |
| Us Bank Na | -- | -- | |
| Us Bank Na | -- | -- | |
| Loventhal Deborah | -- | None Available | |
| Loventhal Robert | $950,000 | First American Title | |
| Ovca Cherilyn | -- | -- | |
| Ovca Charilyn | -- | -- |
Source: Public Records
Mortgage History
| Date | Status | Borrower | Loan Amount |
|---|---|---|---|
| Previous Owner | Loventhal Robert | $712,500 |
Source: Public Records
Tax History Compared to Growth
Tax History
| Year | Tax Paid | Tax Assessment Tax Assessment Total Assessment is a certain percentage of the fair market value that is determined by local assessors to be the total taxable value of land and additions on the property. | Land | Improvement |
|---|---|---|---|---|
| 2024 | $17,446 | $100,000 | $26,914 | $73,086 |
| 2023 | $17,689 | $86,000 | $21,705 | $64,295 |
| 2022 | $17,689 | $86,000 | $21,705 | $64,295 |
| 2021 | $17,751 | $88,276 | $21,705 | $66,571 |
| 2020 | $17,279 | $77,566 | $16,785 | $60,781 |
| 2019 | $16,939 | $84,311 | $16,785 | $67,526 |
| 2018 | $16,654 | $84,311 | $16,785 | $67,526 |
| 2017 | $19,932 | $92,591 | $15,048 | $77,543 |
| 2016 | $18,545 | $92,591 | $15,048 | $77,543 |
| 2015 | $16,967 | $92,591 | $15,048 | $77,543 |
| 2014 | $11,111 | $59,884 | $13,601 | $46,283 |
| 2013 | $10,891 | $59,884 | $13,601 | $46,283 |
Source: Public Records
Map
Nearby Homes
- 2600 N Southport Ave Unit 409
- 1410 W Wrightwood Ave Unit O
- 1427 W Wrightwood Ave Unit 2
- 2720 N Greenview Ave Unit L
- 1344 W Wrightwood Ave Unit 1
- 1532 W Wrightwood Ave Unit 2
- 1313 W Wrightwood Ave Unit 3
- 1313 W Wrightwood Ave Unit 1
- 2642 N Ashland Ave
- 1437 W Diversey Pkwy Unit 1E
- 2501 N Wayne Ave Unit 18
- 2662 N Ashland Ave
- 2743 N Wayne Ave Unit 2753C
- 2616 N Marshfield Ave
- 2418 N Southport Ave Unit 1
- 1529 W Montana St Unit 2
- 1309 W Diversey Pkwy
- 2401 N Janssen Ave Unit 203
- 2401 N Janssen Ave Unit 208
- 2401 N Janssen Ave Unit 402
- 2609 N Greenview Ave Unit A
- 2609 N Greenview Ave Unit 4
- 2609 N Greenview Ave
- 2609 N Greenview Ave
- 2609 N Greenview Ave
- 2609 N Greenview Ave Unit 4
- 2609 N Greenview Ave
- 2609 N Greenview Ave Unit C
- 2609 N Greenview Ave Unit D
- 2609 N Greenview Ave Unit H
- 2609 N Greenview Ave Unit E
- 1434 W Wrightwood Ave
- 1434 W Wrightwood Ave Unit 7S
- 1434 W Wrightwood Ave
- 1434 W Wrightwood Ave
- 1434 W Wrightwood Ave
- 1434 W Wrightwood Ave Unit N
- 2611 N Greenview Ave
- 2611 N Greenview Ave