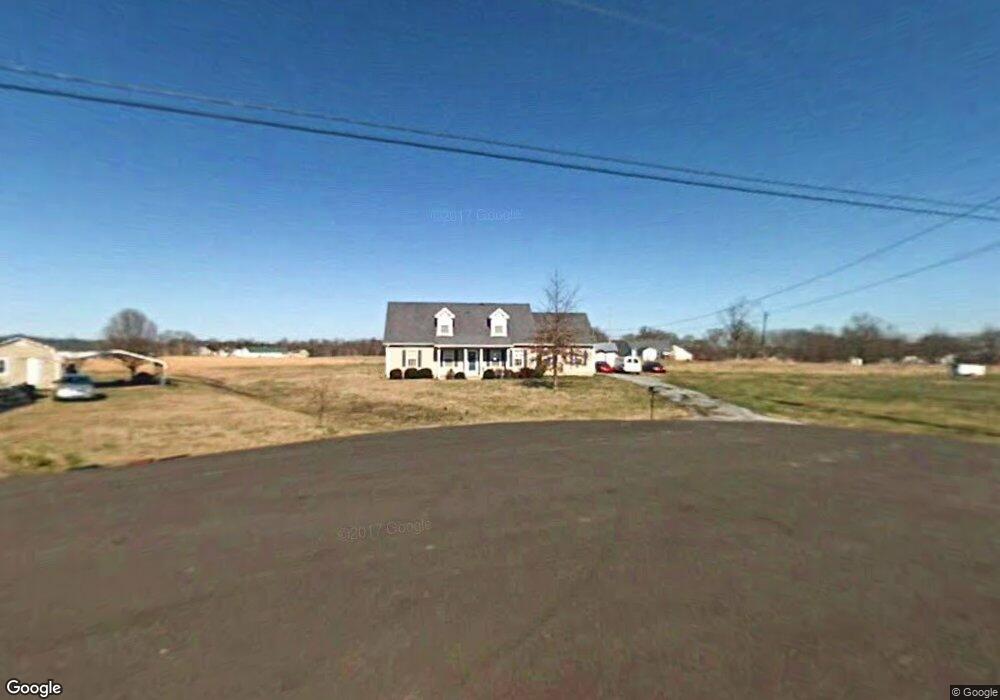
2609 Sundance Ct Christiana, TN 37037
Estimated Value: $313,625 - $382,000
--
Bed
2
Baths
1,232
Sq Ft
$277/Sq Ft
Est. Value
About This Home
This home is located at 2609 Sundance Ct, Christiana, TN 37037 and is currently estimated at $340,906, approximately $276 per square foot. 2609 Sundance Ct is a home located in Rutherford County with nearby schools including Christiana Elementary School, Christiana Middle School, and Rockvale High School.
Ownership History
Date
Name
Owned For
Owner Type
Purchase Details
Closed on
Nov 17, 2000
Sold by
Tucker David M
Bought by
Stem Carl P and Stem Lisa D
Current Estimated Value
Home Financials for this Owner
Home Financials are based on the most recent Mortgage that was taken out on this home.
Original Mortgage
$22,000
Outstanding Balance
$8,072
Interest Rate
7.82%
Estimated Equity
$332,834
Purchase Details
Closed on
Sep 13, 1999
Sold by
Crestar Mortgage
Bought by
Tucker David M and Tucker Julie A
Home Financials for this Owner
Home Financials are based on the most recent Mortgage that was taken out on this home.
Original Mortgage
$90,000
Interest Rate
7.73%
Mortgage Type
Purchase Money Mortgage
Purchase Details
Closed on
Sep 24, 1998
Sold by
Steven Parks John
Bought by
Crestar Mortgage
Purchase Details
Closed on
Sep 8, 1995
Bought by
Steven Parks John
Purchase Details
Closed on
May 2, 1995
Bought by
Ole South Homes Inc
Create a Home Valuation Report for This Property
The Home Valuation Report is an in-depth analysis detailing your home's value as well as a comparison with similar homes in the area
Home Values in the Area
Average Home Value in this Area
Purchase History
| Date | Buyer | Sale Price | Title Company |
|---|---|---|---|
| Stem Carl P | $108,900 | -- | |
| Tucker David M | $90,000 | -- | |
| Crestar Mortgage | $89,171 | -- | |
| Steven Parks John | $81,500 | -- | |
| Ole South Homes Inc | $84,000 | -- |
Source: Public Records
Mortgage History
| Date | Status | Borrower | Loan Amount |
|---|---|---|---|
| Open | Ole South Homes Inc | $22,000 | |
| Open | Ole South Homes Inc | $87,545 | |
| Previous Owner | Ole South Homes Inc | $90,000 |
Source: Public Records
Tax History Compared to Growth
Tax History
| Year | Tax Paid | Tax Assessment Tax Assessment Total Assessment is a certain percentage of the fair market value that is determined by local assessors to be the total taxable value of land and additions on the property. | Land | Improvement |
|---|---|---|---|---|
| 2025 | $1,256 | $66,925 | $13,750 | $53,175 |
| 2024 | $1,256 | $66,925 | $13,750 | $53,175 |
| 2023 | $1,256 | $66,925 | $13,750 | $53,175 |
| 2022 | $1,088 | $67,300 | $13,750 | $53,550 |
| 2021 | $1,016 | $45,800 | $8,625 | $37,175 |
| 2020 | $1,016 | $45,800 | $8,625 | $37,175 |
| 2019 | $1,016 | $45,800 | $8,625 | $37,175 |
| 2018 | $962 | $45,800 | $0 | $0 |
| 2017 | $835 | $31,150 | $0 | $0 |
| 2016 | $835 | $31,150 | $0 | $0 |
| 2015 | $835 | $31,150 | $0 | $0 |
| 2014 | $775 | $31,150 | $0 | $0 |
| 2013 | -- | $30,925 | $0 | $0 |
Source: Public Records
Map
Nearby Homes
- 5334 Shelbyville Pike
- 103 N Wagon Trail
- 317 Richmonds Retreat Blvd
- 148 N Wagon Trail
- 5409 Walnut Farms Blvd
- 5404 Walnut Farms Blvd
- 5414 Walnut Farms Blvd
- 5325 Walnut Chase Dr
- 583 Parsons Rd
- 5531 Compass Way
- 1008 Glenda Dr
- 5741 Stardive Way
- 5323 Clarity Way
- 560 Crosswood Ct
- 1925 Rhonda Dr
- 5226 Clarity Way
- Sequoia Plan at Clearview
- Aspen Plan at Clearview
- Birch Plan at Clearview
- Cedar Plan at Clearview
- 2605 Sundance Ct
- 2614 Sundance Ct
- 2610 Sundance Ct
- 2601 Sundance Ct
- 2606 Sundance Ct
- 2602 Sundance Ct
- 111 Tetanka Ct
- 2513 Sundance Ct
- 106 Tetanka Ct
- 2508 Sundance Ct
- 2509 Sundance Ct
- 107 Tetanka Ct
- 128 Langston Ct
- 2505 Sundance Ct
- 129 Langston Ct
- 2504 Sundance Ct
- 102 Tetanka Ct
- 103 Tetanka Ct
- 7505 Lone Eagle Dr
- 5246 Shelbyville Pike