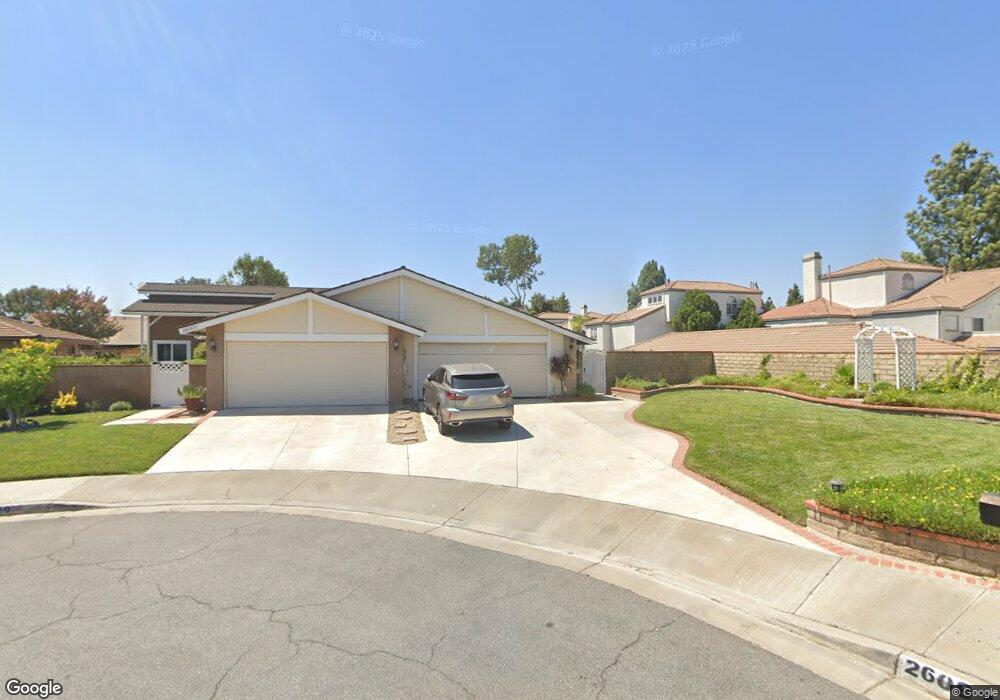
26093 Viento Ct Valencia, CA 91355
Estimated Value: $712,000 - $731,000
3
Beds
2
Baths
1,128
Sq Ft
$641/Sq Ft
Est. Value
About This Home
This home is located at 26093 Viento Ct, Valencia, CA 91355 and is currently estimated at $723,157, approximately $641 per square foot. 26093 Viento Ct is a home located in Los Angeles County with nearby schools including Valencia Valley Elementary School, Placerita Junior High School, and William S. Hart High School.
Ownership History
Date
Name
Owned For
Owner Type
Purchase Details
Closed on
May 11, 1999
Sold by
Kerlin Eric D and Kerlin Julie A
Bought by
Axelgard Christian T
Current Estimated Value
Purchase Details
Closed on
Nov 6, 1997
Sold by
Onori Robert John
Bought by
Onori Renee C
Purchase Details
Closed on
Nov 3, 1997
Sold by
Hallen Renee C and Onori Renee C
Bought by
Kerlin Eric D and Kerlin Julie A
Create a Home Valuation Report for This Property
The Home Valuation Report is an in-depth analysis detailing your home's value as well as a comparison with similar homes in the area
Home Values in the Area
Average Home Value in this Area
Purchase History
| Date | Buyer | Sale Price | Title Company |
|---|---|---|---|
| Axelgard Christian T | $190,000 | Investors Title Company | |
| Onori Renee C | -- | Southland Title Corporation | |
| Kerlin Eric D | $170,500 | Southland Title Corporation |
Source: Public Records
Tax History
| Year | Tax Paid | Tax Assessment Tax Assessment Total Assessment is a certain percentage of the fair market value that is determined by local assessors to be the total taxable value of land and additions on the property. | Land | Improvement |
|---|---|---|---|---|
| 2025 | $4,646 | $297,838 | $200,655 | $97,183 |
| 2024 | $4,476 | $291,999 | $196,721 | $95,278 |
| 2023 | $4,349 | $286,274 | $192,864 | $93,410 |
| 2022 | $4,265 | $280,662 | $189,083 | $91,579 |
| 2021 | $4,194 | $275,160 | $185,376 | $89,784 |
| 2020 | $4,149 | $272,340 | $183,476 | $88,864 |
| 2019 | $4,058 | $267,001 | $179,879 | $87,122 |
| 2018 | $3,920 | $261,766 | $176,352 | $85,414 |
| 2016 | $3,718 | $251,604 | $169,505 | $82,099 |
| 2015 | $3,646 | $247,825 | $166,959 | $80,866 |
| 2014 | $3,588 | $242,971 | $163,689 | $79,282 |
Source: Public Records
Map
Nearby Homes
- 26047 Palomita Dr
- 23629 Del Monte Dr Unit 283
- 26013 Palomita Dr
- 23715 Del Monte Dr Unit 216
- 23735 Del Monte Dr Unit 170
- 23921 Del Monte Dr Unit 34
- 25819 El Gato Place
- 25820 El Gato Place
- 25791 Covala Ct
- 25768 Covala Ct
- 24043 Blacker House Ct
- 25712 Lupita Dr
- 25710 Lupita Dr
- 23549 Via Plata
- 23604 Real Ct
- 26129 Mcbean Pkwy Unit 43
- 23943 Arroyo Park Dr Unit 187
- 23971 Arroyo Park Dr Unit 79
- 26107 Mcbean Pkwy Unit 62
- 25688 Neblina Ct
- 26089 Viento Ct
- 26085 Viento Ct
- 26136 Galvez Ct
- 26132 Galvez Ct
- 26081 Viento Ct
- 26128 Galvez Ct
- 26092 Viento Ct
- 26124 Galvez Ct
- 26077 Viento Ct
- 26120 Galvez Ct
- 26088 Viento Ct
- 26084 Viento Ct
- 26116 Galvez Ct
- 26073 Viento Ct
- 26080 Viento Ct
- 26112 Galvez Ct
- 26076 Viento Ct
- 26067 Viento Ct
- 26108 Galvez Ct
- 26072 Viento Ct
Your Personal Tour Guide
Ask me questions while you tour the home.