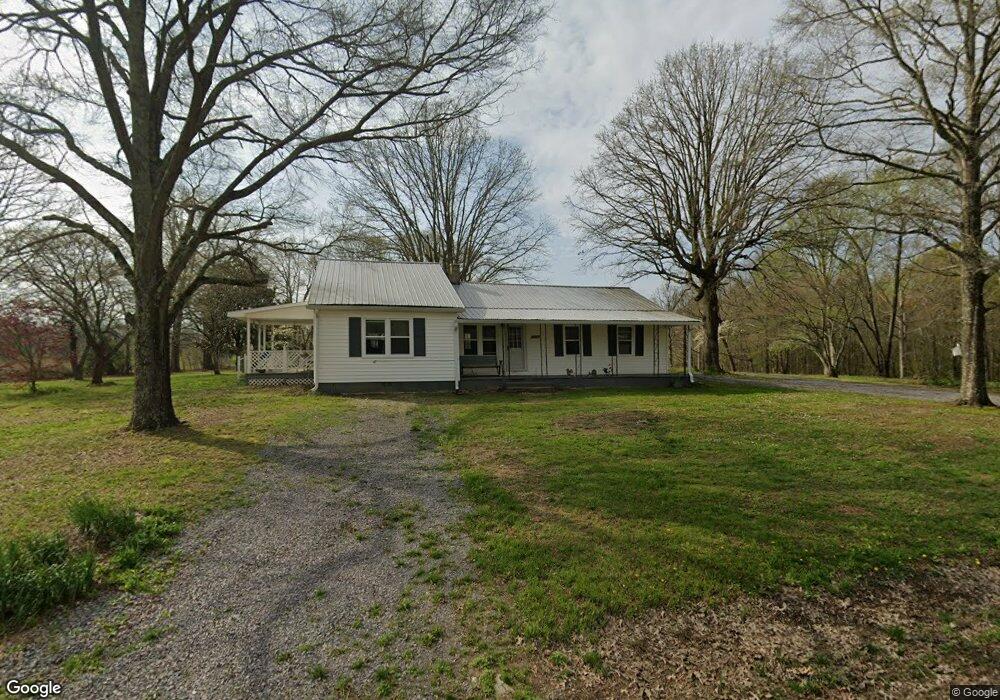
261 Alton Davenport Rd McMinnville, TN 37110
Estimated Value: $164,000 - $283,000
--
Bed
1
Bath
1,767
Sq Ft
$118/Sq Ft
Est. Value
About This Home
This home is located at 261 Alton Davenport Rd, McMinnville, TN 37110 and is currently estimated at $208,799, approximately $118 per square foot. 261 Alton Davenport Rd is a home located in Warren County with nearby schools including Centertown Elementary School, Warren County High School, and Centertown Christian Academy.
Ownership History
Date
Name
Owned For
Owner Type
Purchase Details
Closed on
Feb 16, 2024
Sold by
Bess Jeff
Bought by
Bess Justin and Bess Brittanee
Current Estimated Value
Home Financials for this Owner
Home Financials are based on the most recent Mortgage that was taken out on this home.
Original Mortgage
$150,000
Interest Rate
6.66%
Mortgage Type
Construction
Purchase Details
Closed on
Oct 6, 2022
Sold by
Bess Jeff
Bought by
Myers Steve and Myers Lisa
Purchase Details
Closed on
Oct 29, 2021
Sold by
Bess Penny and Bess Johnny
Bought by
Bess Jeff
Purchase Details
Closed on
Oct 25, 2021
Sold by
Haston James E
Bought by
Bess Jeff
Purchase Details
Closed on
Oct 18, 2021
Sold by
Taylor Adelia Haston
Bought by
Bess Jeff
Purchase Details
Closed on
Oct 13, 2000
Sold by
Hughie Bess
Bought by
Jordan Scott Y and Jordan Lynda Y
Purchase Details
Closed on
Dec 30, 1964
Bought by
Bess Hughie
Create a Home Valuation Report for This Property
The Home Valuation Report is an in-depth analysis detailing your home's value as well as a comparison with similar homes in the area
Home Values in the Area
Average Home Value in this Area
Purchase History
| Date | Buyer | Sale Price | Title Company |
|---|---|---|---|
| Bess Justin | $150,000 | None Listed On Document | |
| Myers Steve | -- | -- | |
| Bess Jeff | $27,333 | None Available | |
| Bess Jeff | $5,466 | None Available | |
| Bess Jeff | $5,466 | None Available | |
| Bess Jeff | $16,401 | None Available | |
| Jordan Scott Y | $38,500 | -- | |
| Bess Hughie | -- | -- |
Source: Public Records
Mortgage History
| Date | Status | Borrower | Loan Amount |
|---|---|---|---|
| Closed | Bess Justin | $150,000 |
Source: Public Records
Tax History Compared to Growth
Tax History
| Year | Tax Paid | Tax Assessment Tax Assessment Total Assessment is a certain percentage of the fair market value that is determined by local assessors to be the total taxable value of land and additions on the property. | Land | Improvement |
|---|---|---|---|---|
| 2024 | $356 | $18,075 | $2,675 | $15,400 |
| 2023 | $356 | $18,075 | $2,675 | $15,400 |
| 2022 | $403 | $20,500 | $4,350 | $16,150 |
| 2021 | $403 | $20,500 | $4,350 | $16,150 |
| 2020 | $371 | $20,500 | $4,350 | $16,150 |
| 2019 | $371 | $16,500 | $4,350 | $12,150 |
| 2018 | $324 | $16,500 | $4,350 | $12,150 |
| 2017 | $324 | $16,500 | $4,350 | $12,150 |
| 2016 | $324 | $16,500 | $4,350 | $12,150 |
| 2015 | $329 | $16,500 | $4,350 | $12,150 |
| 2014 | $314 | $16,500 | $4,350 | $12,150 |
| 2013 | $314 | $15,724 | $0 | $0 |
Source: Public Records
Map
Nearby Homes
- 7324 Jacksboro Rd
- 0 Hidden Valley Cir Unit RTC2907196
- 0 Hidden Valley Cir Unit RTC2907193
- 1450 Pleasant Hill Rd
- 403 Hidden Valley Cir
- 7817 Shelbyville Rd
- 383 Hidden Valley Cir
- Lot 106 Hidden Valley Cir
- Lot 107 Hidden Valley Cir
- 587 Hidden Valley Cir
- 4705 Old Nashville Hwy
- 10 Jacobs St
- 119 Line St
- 1347 Bertha Owen Rd
- 142 Gilbert St
- 1051 Herman Lance Rd
- 128 Pigeon Hill Rd
- 169 Simerly Ln
- 194 Simerly Ln
- 148 Mullican Rd
- 171 Alton Davenport Rd
- 6727 Jacksboro Rd
- 137 Alton Davenport Rd
- 6931 Jacksboro Rd
- 6886 Jacksboro Rd
- 6991 Jacksboro Rd
- 607 Alton Davenport Rd
- 6978 Jacksboro Rd
- 630 Alton Davenport Rd
- 120 Cricket Ln Unit 27
- 6405 Jacksboro Rd
- 7096 Jacksboro Rd
- 7068 Jacksboro Rd
- 777 Alton Davenport Rd
- 7140 Jacksboro Rd
- 760 Alton Davenport Rd
- 7209 Jacksboro Rd
- 54 Mcquade Cir
- 3776 Petigap Rd Unit 3760
- 6301 Jacksboro Rd