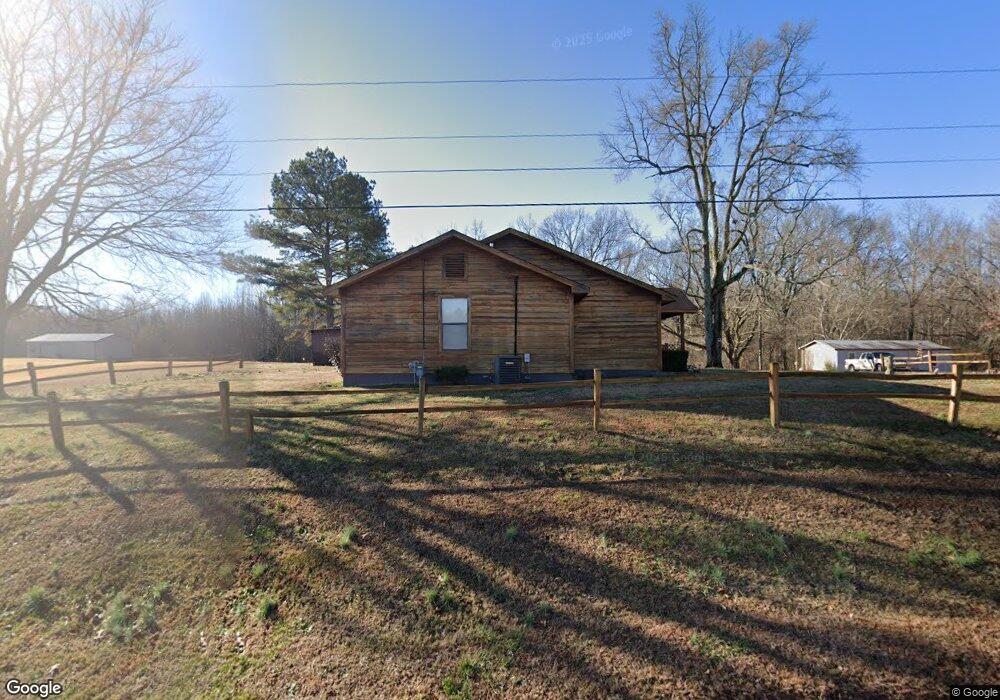
261 Bowman Loop Beech Bluff, TN 38313
Estimated Value: $86,000 - $196,000
Studio
1
Bath
1,520
Sq Ft
$93/Sq Ft
Est. Value
About This Home
This home is located at 261 Bowman Loop, Beech Bluff, TN 38313 and is currently estimated at $140,644, approximately $92 per square foot. 261 Bowman Loop is a home located in Madison County with nearby schools including Rose Hill Middle School, Liberty Technology Magnet High School, and George Thomas Jr Academy at Eden.
Ownership History
Date
Name
Owned For
Owner Type
Purchase Details
Closed on
Mar 12, 1998
Sold by
Diffee Jonathan L
Bought by
Clay Geanes and Clay Clara E
Current Estimated Value
Purchase Details
Closed on
May 15, 1995
Sold by
Thomas Swinford
Bought by
Jonathan Diffee
Purchase Details
Closed on
Mar 21, 1994
Sold by
Gary Gaugh
Bought by
Janice Massey Mary
Purchase Details
Closed on
Mar 18, 1994
Sold by
Harley Gaugh
Bought by
Thomas Swinford
Purchase Details
Closed on
Jun 7, 1984
Bought by
Gaugh Garey G and Gaugh Debby
Purchase Details
Closed on
Feb 19, 1979
Purchase Details
Closed on
Sep 10, 1976
Purchase Details
Closed on
Sep 6, 1973
Create a Home Valuation Report for This Property
The Home Valuation Report is an in-depth analysis detailing your home's value as well as a comparison with similar homes in the area
Purchase History
| Date | Buyer | Sale Price | Title Company |
|---|---|---|---|
| Clay Geanes | $55,000 | -- | |
| Jonathan Diffee | $50,000 | -- | |
| Janice Massey Mary | $500 | -- | |
| Thomas Swinford | -- | -- | |
| Gaugh Garey G | -- | -- | |
| -- | -- | -- | |
| -- | -- | -- | |
| -- | -- | -- |
Source: Public Records
Tax History
| Year | Tax Paid | Tax Assessment Tax Assessment Total Assessment is a certain percentage of the fair market value that is determined by local assessors to be the total taxable value of land and additions on the property. | Land | Improvement |
|---|---|---|---|---|
| 2025 | $390 | $20,800 | $2,000 | $18,800 |
| 2024 | $390 | $20,800 | $2,000 | $18,800 |
| 2022 | $390 | $20,800 | $2,000 | $18,800 |
| 2021 | $345 | $14,700 | $2,000 | $12,700 |
| 2020 | $345 | $14,700 | $2,000 | $12,700 |
| 2019 | $345 | $14,700 | $2,000 | $12,700 |
| 2018 | $345 | $14,700 | $2,000 | $12,700 |
| 2017 | $362 | $14,775 | $2,000 | $12,775 |
| 2016 | $318 | $14,775 | $2,000 | $12,775 |
| 2015 | $318 | $14,775 | $2,000 | $12,775 |
| 2014 | $318 | $14,775 | $2,000 | $12,775 |
Source: Public Records
Map
Nearby Homes
- 90 Bowman Loop
- 4066 Beech Bluff Rd
- 4735 Beech Bluff Rd
- 0 Hammlett Rd
- 592 Hubberd Town Rd
- 900 Hubberd Town Rd
- 0 Fowler Rd Unit RTC3148248
- 715 Roundtree Ln
- 479 Fowler Rd
- 0 Cotton Grove Rd
- 19 Chisum Ln
- 00 Beech Bluff Rd
- 3140 Beech Bluff Rd
- 0 Tennessee 200
- 115 Calvin Dr
- 3011 Crucifer Rd
- 367 Deep Gap Rd
- 3001 Beech Bluff Rd
- 184 Deep Gap Rd
- 1865 Highway 200
- 271 Bowman Loop
- 270 Bowman Loop
- 20 March Cove
- 241 Bowman Loop
- 32 March Cove
- 291 Bowman Loop
- 290 Bowman Loop
- 39 March Cove
- 4443 Beech Bluff Rd
- 4435 Beech Bluff Rd
- 240 Bowman Loop
- 4431 Beech Bluff Rd
- 4427 Beech Bluff Rd
- 4444 Beech Bluff Rd
- 4469 Beech Bluff Rd
- 4454 Beech Bluff Rd
- 4434 Beech Bluff Rd
- 4473 Beech Bluff Rd
- 4460 Beech Bluff Rd
- 4466 Beech Bluff Rd
Your Personal Tour Guide
Ask me questions while you tour the home.