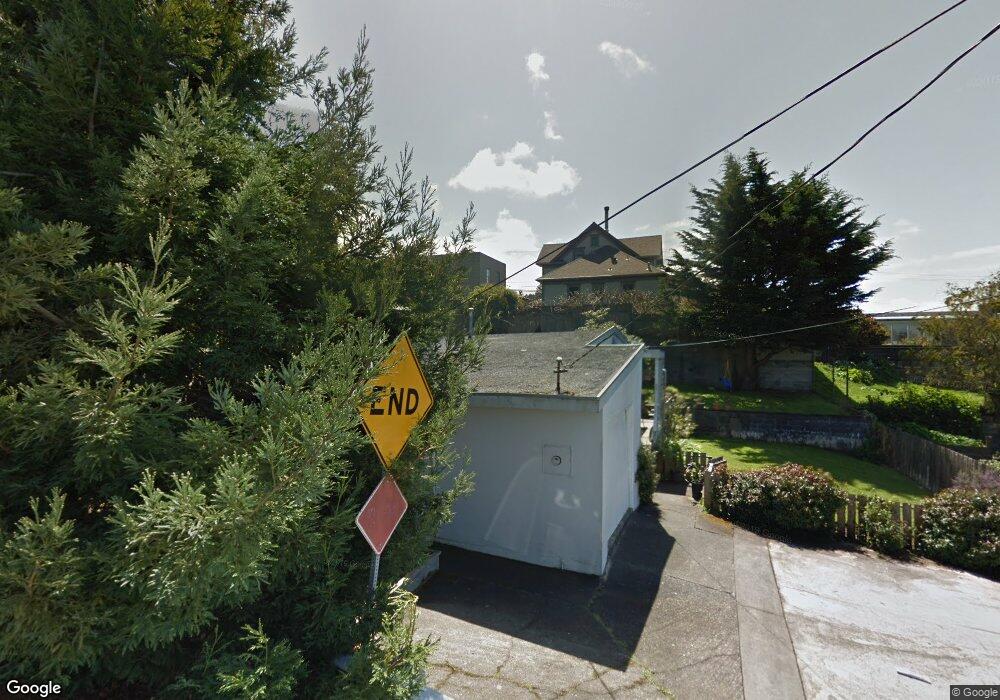
261 E 11th St Arcata, CA 95521
East Arcata-Bay View NeighborhoodEstimated Value: $382,000 - $467,000
2
Beds
1
Bath
800
Sq Ft
$533/Sq Ft
Est. Value
About This Home
This home is located at 261 E 11th St, Arcata, CA 95521 and is currently estimated at $426,565, approximately $533 per square foot. 261 E 11th St is a home located in Humboldt County with nearby schools including Arcata Elementary School, Sunny Brae Middle School, and Arcata High School.
Ownership History
Date
Name
Owned For
Owner Type
Purchase Details
Closed on
May 4, 2023
Sold by
Doren A Morgan Trust
Bought by
Kenas Erik
Current Estimated Value
Home Financials for this Owner
Home Financials are based on the most recent Mortgage that was taken out on this home.
Original Mortgage
$408,600
Outstanding Balance
$397,093
Interest Rate
6.32%
Mortgage Type
VA
Estimated Equity
$29,472
Purchase Details
Closed on
Dec 7, 2013
Sold by
Morgan Doren Anthony
Bought by
Morgan Doren A and Doren A Morgan Trust
Purchase Details
Closed on
Aug 1, 2013
Sold by
Morgan Doren Anthony and Rose Ann Morgan Exemption Trus
Bought by
Morgan Doren Anthony and Morgan Dennis A
Purchase Details
Closed on
Apr 20, 2010
Sold by
Morgan Dennis A and Morgan Family Trust
Bought by
Morgan Dennis A and Rose Ann Morgan Exemption Trus
Purchase Details
Closed on
Aug 31, 2005
Sold by
Morgan Dennis A and Morgan Rose Ann
Bought by
Morgan Dennis A and Morgan Rose Ann
Create a Home Valuation Report for This Property
The Home Valuation Report is an in-depth analysis detailing your home's value as well as a comparison with similar homes in the area
Home Values in the Area
Average Home Value in this Area
Purchase History
| Date | Buyer | Sale Price | Title Company |
|---|---|---|---|
| Kenas Erik | $400,000 | Fidelity National Title Compan | |
| Morgan Doren A | -- | None Available | |
| Morgan Doren Anthony | -- | None Available | |
| Morgan Dennis A | -- | None Available | |
| Morgan Dennis A | -- | -- |
Source: Public Records
Mortgage History
| Date | Status | Borrower | Loan Amount |
|---|---|---|---|
| Open | Kenas Erik | $408,600 |
Source: Public Records
Tax History
| Year | Tax Paid | Tax Assessment Tax Assessment Total Assessment is a certain percentage of the fair market value that is determined by local assessors to be the total taxable value of land and additions on the property. | Land | Improvement |
|---|---|---|---|---|
| 2025 | $4,649 | $416,160 | $208,080 | $208,080 |
| 2024 | $4,649 | $408,000 | $204,000 | $204,000 |
| 2023 | $819 | $45,500 | $9,742 | $35,758 |
| 2022 | $827 | $44,608 | $9,551 | $35,057 |
| 2021 | $800 | $43,734 | $9,364 | $34,370 |
| 2020 | $677 | $43,286 | $9,268 | $34,018 |
| 2019 | $660 | $42,438 | $9,087 | $33,351 |
| 2018 | $648 | $41,607 | $8,909 | $32,698 |
| 2017 | $630 | $40,792 | $8,735 | $32,057 |
| 2016 | $595 | $39,993 | $8,564 | $31,429 |
| 2015 | $590 | $39,393 | $8,436 | $30,957 |
| 2014 | $627 | $38,622 | $8,271 | $30,351 |
Source: Public Records
Map
Nearby Homes
- 120 & 120a 13th St
- 751 Patrick Ct
- 753 Shirley Blvd
- 632 9th St
- 1524 Beverly Dr
- 57 & 77 F St
- 119 Sylva St
- 16 & 46 G St
- 113 Sylva St
- 330 California Ave
- 1754 Virginia Way
- 1096 Diamond Dr
- 2700 Meadow Creek Way
- 812 Diamond Dr
- 1666 Stewart Ave
- 3122 St Louis Rd
- 1254 Mccallum Cir
- 3028 Alliance Rd
- 2099 Fickle Hill Rd
- 3255 Buttermilk Ln
Your Personal Tour Guide
Ask me questions while you tour the home.