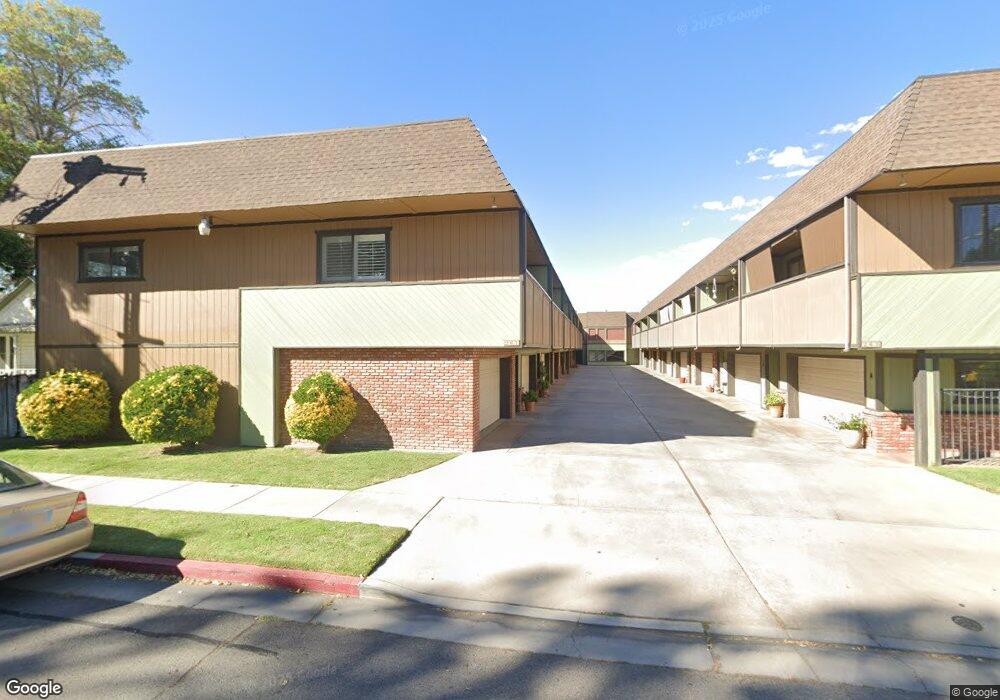
261 E Line St Unit H Bishop, CA 93514
Estimated Value: $340,637 - $399,000
2
Beds
2
Baths
1,387
Sq Ft
$267/Sq Ft
Est. Value
About This Home
This home is located at 261 E Line St Unit H, Bishop, CA 93514 and is currently estimated at $370,879, approximately $267 per square foot. 261 E Line St Unit H is a home located in Inyo County with nearby schools including Bishop Elementary School, Home Street Middle School, and Bishop Union High School.
Ownership History
Date
Name
Owned For
Owner Type
Purchase Details
Closed on
Jun 28, 2019
Sold by
Turner Sara and Birkhimer Sara
Bought by
Nyquist Nicholas
Current Estimated Value
Home Financials for this Owner
Home Financials are based on the most recent Mortgage that was taken out on this home.
Original Mortgage
$178,000
Outstanding Balance
$154,976
Interest Rate
3.73%
Mortgage Type
New Conventional
Estimated Equity
$215,903
Purchase Details
Closed on
Feb 17, 2012
Sold by
Mellon George Thomas
Bought by
Birkhimer Sara
Purchase Details
Closed on
Dec 17, 2004
Sold by
Hubbard Lola K
Bought by
Mellon George Thomas
Home Financials for this Owner
Home Financials are based on the most recent Mortgage that was taken out on this home.
Original Mortgage
$115,500
Interest Rate
5.87%
Mortgage Type
Purchase Money Mortgage
Create a Home Valuation Report for This Property
The Home Valuation Report is an in-depth analysis detailing your home's value as well as a comparison with similar homes in the area
Home Values in the Area
Average Home Value in this Area
Purchase History
| Date | Buyer | Sale Price | Title Company |
|---|---|---|---|
| Nyquist Nicholas | $245,000 | Inyo Mono Title Co | |
| Birkhimer Sara | $153,000 | Mountain Title Company | |
| Mellon George Thomas | $235,000 | Inyo Mono Title Company |
Source: Public Records
Mortgage History
| Date | Status | Borrower | Loan Amount |
|---|---|---|---|
| Open | Nyquist Nicholas | $178,000 | |
| Previous Owner | Mellon George Thomas | $115,500 |
Source: Public Records
Tax History
| Year | Tax Paid | Tax Assessment Tax Assessment Total Assessment is a certain percentage of the fair market value that is determined by local assessors to be the total taxable value of land and additions on the property. | Land | Improvement |
|---|---|---|---|---|
| 2025 | $2,805 | $267,937 | $53,586 | $214,351 |
| 2024 | $2,805 | $262,685 | $52,536 | $210,149 |
| 2023 | $2,743 | $257,535 | $51,506 | $206,029 |
| 2022 | $2,732 | $252,487 | $50,497 | $201,990 |
| 2021 | $2,689 | $247,537 | $49,507 | $198,030 |
| 2020 | $1,801 | $245,000 | $49,000 | $196,000 |
| 2019 | $1,801 | $172,268 | $56,296 | $115,972 |
| 2018 | $1,761 | $168,892 | $55,193 | $113,699 |
| 2017 | $1,724 | $165,581 | $54,111 | $111,470 |
| 2016 | $1,704 | $162,335 | $53,050 | $109,285 |
| 2015 | $1,670 | $159,898 | $52,254 | $107,644 |
| 2014 | $1,635 | $156,767 | $51,231 | $105,536 |
Source: Public Records
Map
Nearby Homes
- 175 Hanby Ave
- 325 E Pine St
- 771 N Main St Unit 124
- 399 E Yaney St Unit 53
- 399 E Yaney #53 St
- 718 Keough St
- 0 US Highway 6
- 2278 Sunrise Dr
- 2205 Edinburgh Ave
- 690 Summer Haze Cir
- 1443 Shelly Creek Rd
- 2229 Fiora Ave
- 2322 Galloway Ave
- 800 Valley West Cir
- 2307 Galloway Ave
- 2268 Mcgalliard Ave
- 1528 Argyle Ln
- 2280 Baskerville Ave
- 2222 Brigadoon Ave
- 807 S Barlow Ln
- 261 E Line St Unit 4 D
- 261 E Line St Unit E
- 261 E Line St Unit H
- 261 E Line St Unit 1
- 261 E Line St Unit F
- 261 E Line St
- 261 E Line St
- 219 E Line St
- 263 E Line #G St Unit 15
- 263 E Line St Unit F
- 263 E Line St Unit B
- 263 E Line St
- 263 E Line St Unit C
- 263 E Line St Unit 1
- 263 E Line St Unit 15
- 263 E Line St Unit A
- 263 E Line #C St
- 263 E Line #C St Unit 11
- 175 N 3rd St Unit 1
- 175 N 3rd St
Your Personal Tour Guide
Ask me questions while you tour the home.