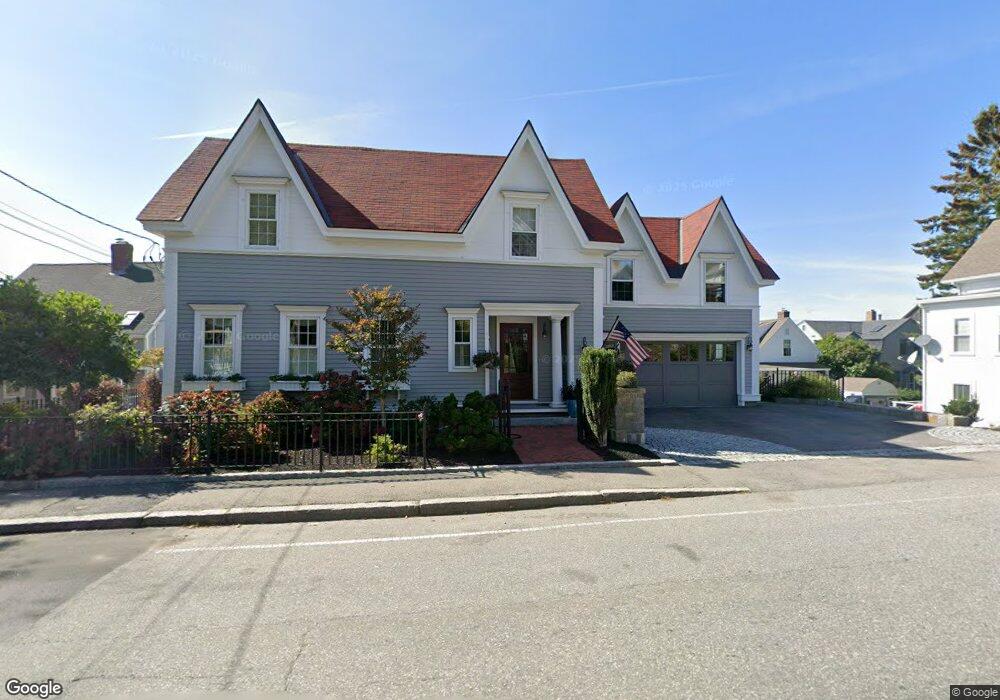
261 E Main St Gloucester, MA 01930
East Gloucester NeighborhoodEstimated Value: $1,273,000 - $2,708,000
4
Beds
3
Baths
2,347
Sq Ft
$922/Sq Ft
Est. Value
About This Home
This home is located at 261 E Main St, Gloucester, MA 01930 and is currently estimated at $2,163,449, approximately $921 per square foot. 261 E Main St is a home located in Essex County with nearby schools including East Gloucester Elementary School, Ralph B O'maley Middle School, and Gloucester High School.
Ownership History
Date
Name
Owned For
Owner Type
Purchase Details
Closed on
Mar 11, 2020
Sold by
Campbell Carole M and Campbell David S
Bought by
Campbell Ft
Current Estimated Value
Purchase Details
Closed on
Oct 21, 2014
Sold by
Campbell Construction
Bought by
Campbell David S and Campbell Carole M
Purchase Details
Closed on
Jun 22, 2010
Sold by
Mjp Rt
Bought by
Campbell Constr Grp Ll
Home Financials for this Owner
Home Financials are based on the most recent Mortgage that was taken out on this home.
Original Mortgage
$1,235,000
Interest Rate
5.03%
Mortgage Type
Purchase Money Mortgage
Purchase Details
Closed on
Dec 30, 1991
Sold by
Alho Michele A
Bought by
Phillips Martha J
Create a Home Valuation Report for This Property
The Home Valuation Report is an in-depth analysis detailing your home's value as well as a comparison with similar homes in the area
Home Values in the Area
Average Home Value in this Area
Purchase History
| Date | Buyer | Sale Price | Title Company |
|---|---|---|---|
| Campbell Ft | -- | None Available | |
| Campbell David S | -- | -- | |
| Campbell Constr Grp Ll | $1,150,000 | -- | |
| Phillips Martha J | $10,000 | -- |
Source: Public Records
Mortgage History
| Date | Status | Borrower | Loan Amount |
|---|---|---|---|
| Previous Owner | Phillips Martha J | $575,000 | |
| Previous Owner | Phillips Martha J | $1,235,000 | |
| Previous Owner | Phillips Martha J | $269,200 |
Source: Public Records
Tax History
| Year | Tax Paid | Tax Assessment Tax Assessment Total Assessment is a certain percentage of the fair market value that is determined by local assessors to be the total taxable value of land and additions on the property. | Land | Improvement |
|---|---|---|---|---|
| 2025 | $20,466 | $2,105,600 | $1,134,200 | $971,400 |
| 2024 | $19,965 | $2,051,900 | $1,080,500 | $971,400 |
| 2023 | $18,749 | $1,770,400 | $922,300 | $848,100 |
| 2022 | $18,115 | $1,544,300 | $801,800 | $742,500 |
| 2021 | $17,465 | $1,403,900 | $728,300 | $675,600 |
| 2020 | $17,459 | $1,416,000 | $728,300 | $687,700 |
| 2019 | $16,793 | $1,323,300 | $694,400 | $628,900 |
| 2018 | $16,367 | $1,265,800 | $677,500 | $588,300 |
| 2017 | $15,864 | $1,202,700 | $645,100 | $557,600 |
| 2016 | $14,682 | $1,078,800 | $617,600 | $461,200 |
| 2015 | -- | $1,029,200 | $603,500 | $425,700 |
Source: Public Records
Map
Nearby Homes
- 1 Wonson St
- 73 Rocky Neck Ave Unit 2
- 60 Rocky Neck Ave Unit 202
- 197 E Main St Unit 1
- 15 Raven Ln Unit 15
- 10 Seaview Rd
- 11 Ocean View Dr
- 191 Main St Unit 3
- 191 Main St Unit 2A
- 139A Prospect St
- 35 Middle St Unit 4
- 33 Middle St
- 3 Mondello Square
- 15 Mount Vernon St
- 36 Eastern Ave
- 113 Pleasant St
- 50 Warner St
- 33 Maplewood Ave Unit 310
- 87 Atlantic Rd Unit 2
- 5 Wise Place
- 261 E Main St Unit 7&8
- 261 E Main St
- 259 E Main St
- 259 E Main St
- 263 E Main St
- 234 E Main St
- 236 E Main St
- 265 E Main St Unit 1
- 265 E Main St
- 238 E Main St
- 3 Gerring Rd
- 1 Barberry Ln
- 255 E Main St
- 257 E Main St
- 230 E Main St
- 3 Barberry Ln
- 240 E Main St
- 7 Barberry Ln
- 253 E Main St
- 267 E Main St Unit R
Your Personal Tour Guide
Ask me questions while you tour the home.