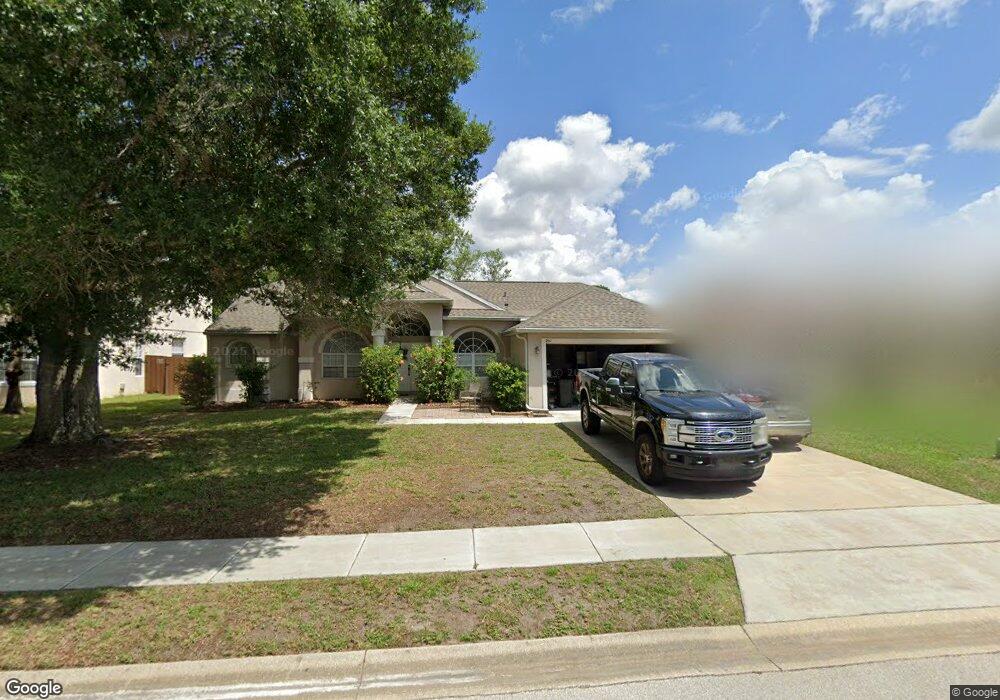
261 Englenook Dr Debary, FL 32713
Estimated Value: $368,811 - $416,000
3
Beds
2
Baths
2,724
Sq Ft
$145/Sq Ft
Est. Value
About This Home
This home is located at 261 Englenook Dr, Debary, FL 32713 and is currently estimated at $394,703, approximately $144 per square foot. 261 Englenook Dr is a home located in Volusia County with nearby schools including Debary Elementary School, River Springs Middle School, and University High School.
Ownership History
Date
Name
Owned For
Owner Type
Purchase Details
Closed on
Jul 11, 2023
Sold by
Sfr Jv-2 Property Llc
Bought by
Sfr Jv-2 2023-1 Borrower Llc
Current Estimated Value
Purchase Details
Closed on
Dec 21, 2021
Sold by
Rockethouzz Investment Group Llc
Bought by
Sfr Jv-2 Property Llc
Purchase Details
Closed on
Dec 20, 2021
Sold by
Suri and Sonia
Bought by
Rockethouzz Investment Group Llc
Purchase Details
Closed on
Jul 8, 2005
Sold by
Kucera Tonya and Kucera Frank J
Bought by
Suri Sanjay and Suri Sonia
Home Financials for this Owner
Home Financials are based on the most recent Mortgage that was taken out on this home.
Original Mortgage
$214,400
Interest Rate
4.87%
Mortgage Type
Purchase Money Mortgage
Purchase Details
Closed on
Nov 30, 1999
Sold by
Engle Homes Orlando Inc
Bought by
Kucera Frank Joseph
Home Financials for this Owner
Home Financials are based on the most recent Mortgage that was taken out on this home.
Original Mortgage
$132,950
Interest Rate
7.87%
Create a Home Valuation Report for This Property
The Home Valuation Report is an in-depth analysis detailing your home's value as well as a comparison with similar homes in the area
Home Values in the Area
Average Home Value in this Area
Purchase History
| Date | Buyer | Sale Price | Title Company |
|---|---|---|---|
| Sfr Jv-2 2023-1 Borrower Llc | $100 | None Listed On Document | |
| Sfr Jv-2 Property Llc | $336,500 | None Listed On Document | |
| Rockethouzz Investment Group Llc | $320,000 | Os National | |
| Suri Sanjay | $268,000 | Esquire Title Services Inc | |
| Kucera Frank Joseph | $140,000 | -- |
Source: Public Records
Mortgage History
| Date | Status | Borrower | Loan Amount |
|---|---|---|---|
| Previous Owner | Suri Sanjay | $214,400 | |
| Previous Owner | Kucera Frank Joseph | $132,950 |
Source: Public Records
Tax History
| Year | Tax Paid | Tax Assessment Tax Assessment Total Assessment is a certain percentage of the fair market value that is determined by local assessors to be the total taxable value of land and additions on the property. | Land | Improvement |
|---|---|---|---|---|
| 2026 | $5,638 | $326,718 | $65,170 | $261,548 |
| 2025 | $5,638 | $326,718 | $65,170 | $261,548 |
| 2024 | $5,400 | $310,793 | $58,310 | $252,483 |
| 2023 | $5,400 | $325,265 | $51,450 | $273,815 |
| 2022 | $5,004 | $295,087 | $45,276 | $249,811 |
| 2021 | $4,261 | $230,466 | $28,469 | $201,997 |
| 2020 | $3,936 | $207,120 | $26,754 | $180,366 |
| 2019 | $4,214 | $205,032 | $24,696 | $180,336 |
| 2018 | $3,912 | $195,910 | $17,493 | $178,417 |
| 2017 | $3,812 | $185,083 | $17,553 | $167,530 |
| 2016 | $3,361 | $156,658 | $0 | $0 |
| 2015 | $3,274 | $147,969 | $0 | $0 |
| 2014 | $2,951 | $132,917 | $0 | $0 |
Source: Public Records
Map
Nearby Homes
- 30 Sanford Ave
- 118 Cedar Springs Cir
- 29 Volusia Dr
- 9 Granada Rd
- 150 Serena Rd
- 210 Buena Vista St Unit Lot 1
- 210 Buena Vista St
- 367 Hickory Springs Place Unit 4
- 29 Lake Dr
- 226 Grande Vista St
- 24 Plantation Rd
- 157 Plantation Rd
- 130 Laurianne Rd
- 88 Dirksen Dr
- 34 S Charles Richard Beall Blvd
- 257 Lago Vista St
- 49 Azalea Dr
- 111 Colomba Rd
- 601 Becklow St
- 112 Colomba Rd
- 257 Englenook Dr
- 265 Englenook Dr
- 269 Englenook Dr
- 29 Sanford Ave
- 253 Englenook Dr
- 264 Englenook Dr
- 260 Englenook Dr
- 31 Sanford Ave
- 268 Englenook Dr
- 256 Englenook Dr
- 273 Englenook Dr
- 249 Englenook Dr
- 27 Sanford Ave
- 33 Sanford Ave
- 252 Englenook Dr
- 272 Englenook Dr
- 277 Englenook Dr
- 58 Forest Eagle Ct Unit III
- 245 Englenook Dr
- 62 Forest Eagle Ct
Your Personal Tour Guide
Ask me questions while you tour the home.