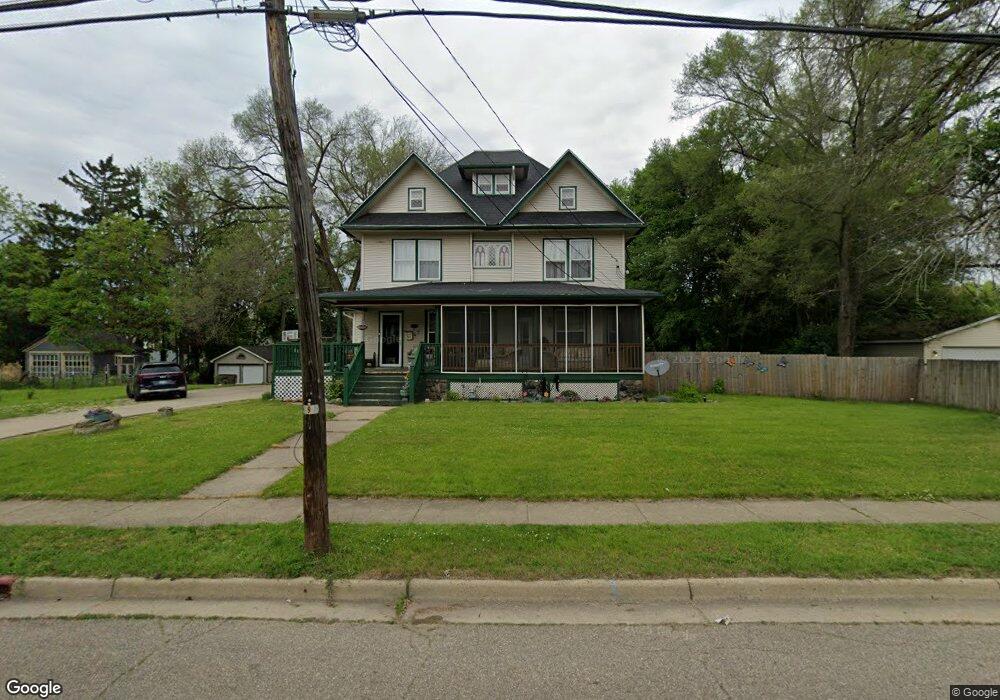
261 Garfield Ave Battle Creek, MI 49017
Northeast Battle Creek NeighborhoodEstimated Value: $127,000
4
Beds
1
Bath
3,136
Sq Ft
$40/Sq Ft
Est. Value
About This Home
This home is located at 261 Garfield Ave, Battle Creek, MI 49017 and is currently priced at $127,000, approximately $40 per square foot. 261 Garfield Ave is a home located in Calhoun County with nearby schools including Northwestern Middle School, Battle Creek Central High School, and St. Philip Catholic Central High School.
Ownership History
Date
Name
Owned For
Owner Type
Purchase Details
Closed on
Oct 16, 2017
Sold by
Neighborhoods Inc
Bought by
Gipson Jemmie G and Gipson Patty A
Current Estimated Value
Home Financials for this Owner
Home Financials are based on the most recent Mortgage that was taken out on this home.
Original Mortgage
$93,610
Outstanding Balance
$78,107
Interest Rate
3.78%
Mortgage Type
FHA
Purchase Details
Closed on
Nov 14, 2011
Sold by
The Calhoun County Land Bank Authority
Bought by
Neighborhoods Inc Of Battle Creek
Purchase Details
Closed on
Dec 22, 2010
Sold by
Neighborhoods Inc Of Battle Creek
Bought by
Calhoun County Land Bank Authority
Purchase Details
Closed on
Apr 30, 2001
Bought by
Esposito Jennifer G
Purchase Details
Closed on
Dec 1, 2000
Sold by
Skaggs Eric W and Skaggs Tammy J
Bought by
Neighborhoods Inc
Purchase Details
Closed on
Oct 17, 1996
Bought by
Skaggs
Purchase Details
Closed on
Oct 20, 1995
Bought by
Kiczenski and Sullivan
Create a Home Valuation Report for This Property
The Home Valuation Report is an in-depth analysis detailing your home's value as well as a comparison with similar homes in the area
Home Values in the Area
Average Home Value in this Area
Purchase History
| Date | Buyer | Sale Price | Title Company |
|---|---|---|---|
| Gipson Jemmie G | $65,000 | Equity Natl Title & Closing | |
| Neighborhoods Inc Of Battle Creek | -- | None Available | |
| Calhoun County Land Bank Authority | -- | None Available | |
| Esposito Jennifer G | $128,000 | -- | |
| Neighborhoods Inc | -- | -- | |
| Skaggs | $13,500 | -- | |
| Kiczenski | $5,100 | -- |
Source: Public Records
Mortgage History
| Date | Status | Borrower | Loan Amount |
|---|---|---|---|
| Open | Gipson Jemmie G | $93,610 |
Source: Public Records
Tax History Compared to Growth
Tax History
| Year | Tax Paid | Tax Assessment Tax Assessment Total Assessment is a certain percentage of the fair market value that is determined by local assessors to be the total taxable value of land and additions on the property. | Land | Improvement |
|---|---|---|---|---|
| 2021 | -- | $0 | $0 | $0 |
| 2020 | $0 | $54,566 | $0 | $0 |
| 2019 | $1,745 | $49,236 | $0 | $0 |
| 2018 | $1,745 | $42,144 | $3,157 | $38,987 |
| 2017 | $1,691 | $39,254 | $0 | $0 |
| 2016 | $1,688 | $37,240 | $0 | $0 |
| 2015 | $1,680 | $36,463 | $10,480 | $25,983 |
| 2014 | $1,680 | $36,463 | $10,480 | $25,983 |
Source: Public Records
Map
Nearby Homes