
Buyer's Agent in 2020
Kyle Van Der Velde
van der Velde and Company
(360) 303-8174
24 in this area
132 Total Sales

Estimated Value: $726,645 - $844,000
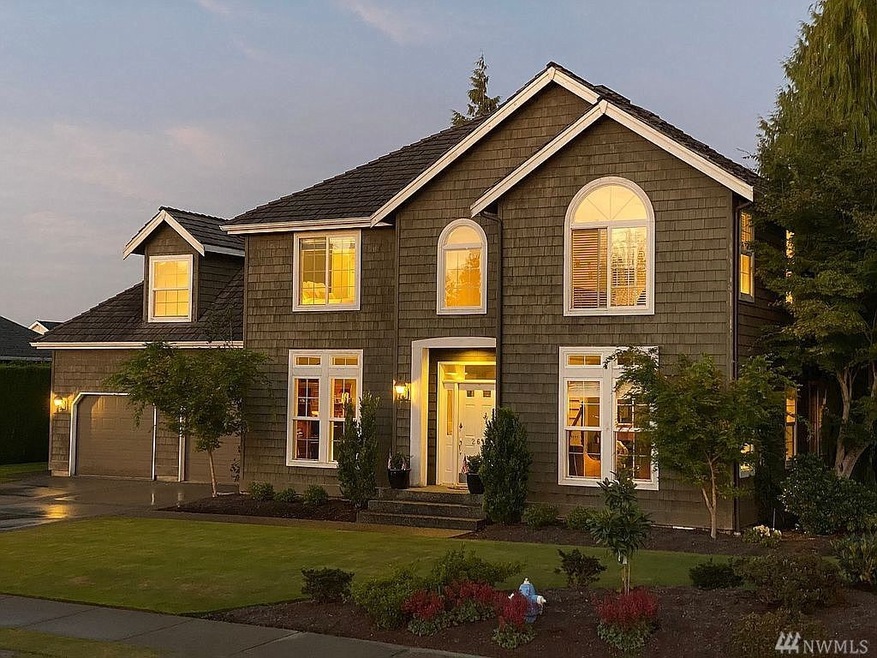
This home is located at 261 Maberry Loop, Lynden, WA 98264 since 09 November 2020 and is currently estimated at $782,661, approximately $285 per square foot. This property was built in 1993. 261 Maberry Loop is a home located in Whatcom County with nearby schools including Lynden High School, Lynden Christian Schools: Administration, and Lynden Christian School.
Source: Northwest Multiple Listing Service (NWMLS)
MLS#: NWM1687882
| Date | Buyer | Sale Price | Title Company |
|---|---|---|---|
| Vandervelde Kyle D | $10,728,400 | Whatcom Land Title | |
| Vandervelde Kyle D | $653,000 | Whatcom Land Title Co Inc |
| Date | Status | Borrower | Loan Amount |
|---|---|---|---|
| Open | Vandervelde Kyle D | $587,700 | |
| Closed | Vandervelde Kyle D | $0 |
| Date | Event | Price | List to Sale | Price per Sq Ft |
|---|---|---|---|---|
| 11/09/2020 11/09/20 | Sold | $653,000 | 0.0% | $238 / Sq Ft |
| 11/09/2020 11/09/20 | For Sale | $653,000 | -- | $238 / Sq Ft |
| Year | Tax Paid | Tax Assessment Tax Assessment Total Assessment is a certain percentage of the fair market value that is determined by local assessors to be the total taxable value of land and additions on the property. | Land | Improvement |
|---|---|---|---|---|
| 2025 | $5,191 | $702,426 | $272,825 | $429,601 |
| 2024 | $4,853 | $685,387 | $242,500 | $442,887 |
| 2023 | $4,853 | $675,853 | $250,000 | $425,853 |
| 2022 | $4,879 | $307,136 | $198,561 | $108,575 |
| 2021 | $4,786 | $529,671 | $164,098 | $365,573 |
| 2020 | $4,192 | $472,933 | $146,520 | $326,413 |
| 2019 | $3,729 | $433,742 | $134,530 | $299,212 |
| 2018 | $4,076 | $395,567 | $122,551 | $273,016 |
| 2017 | $3,750 | $355,055 | $110,000 | $245,055 |
| 2016 | $3,540 | $347,452 | $107,800 | $239,652 |
| 2015 | $3,138 | $326,241 | $103,684 | $222,557 |
| 2014 | -- | $315,187 | $100,156 | $215,031 |
| 2013 | -- | $313,031 | $98,000 | $215,031 |
Buyer's Agent in 2020
Kyle Van Der Velde
van der Velde and Company
(360) 303-8174
24 in this area
132 Total Sales
Source: Northwest Multiple Listing Service (NWMLS)
MLS Number: NWM1687882
APN: 400317-462200-0000
Disclaimer: Certain information contained herein is derived from information provided by parties other than Homes.com. All information provided is deemed reliable, but is not guaranteed to be accurate and should be independently verified.
![]() All data is obtained from various sources and may not have been verified by broker or MLS GRID. Supplied Open House Information is subject to change without notice. All information should be independently reviewed and verified for accuracy. Properties may or may not be listed by the office/agent presenting the information. Listing information is provided by the Northwest Multiple Listing Service (NWMLS). Property information is based on available data that may include MLS information, county records, and other sources. Listings marked with the 3 tree icon and provided by NWMLS. All properties are subject to prior sale or withdrawal. IDX information is provided exclusively for consumers’ personal noncommercial use, that it may not be used for any purpose other than to identify prospective properties consumers may be interested in purchasing, that the data is deemed reliable but is not guaranteed by MLS GRID. ©2026 NWMLS.
All data is obtained from various sources and may not have been verified by broker or MLS GRID. Supplied Open House Information is subject to change without notice. All information should be independently reviewed and verified for accuracy. Properties may or may not be listed by the office/agent presenting the information. Listing information is provided by the Northwest Multiple Listing Service (NWMLS). Property information is based on available data that may include MLS information, county records, and other sources. Listings marked with the 3 tree icon and provided by NWMLS. All properties are subject to prior sale or withdrawal. IDX information is provided exclusively for consumers’ personal noncommercial use, that it may not be used for any purpose other than to identify prospective properties consumers may be interested in purchasing, that the data is deemed reliable but is not guaranteed by MLS GRID. ©2026 NWMLS.
Based on information submitted to the MLS GRID
Ask me questions while you tour the home.