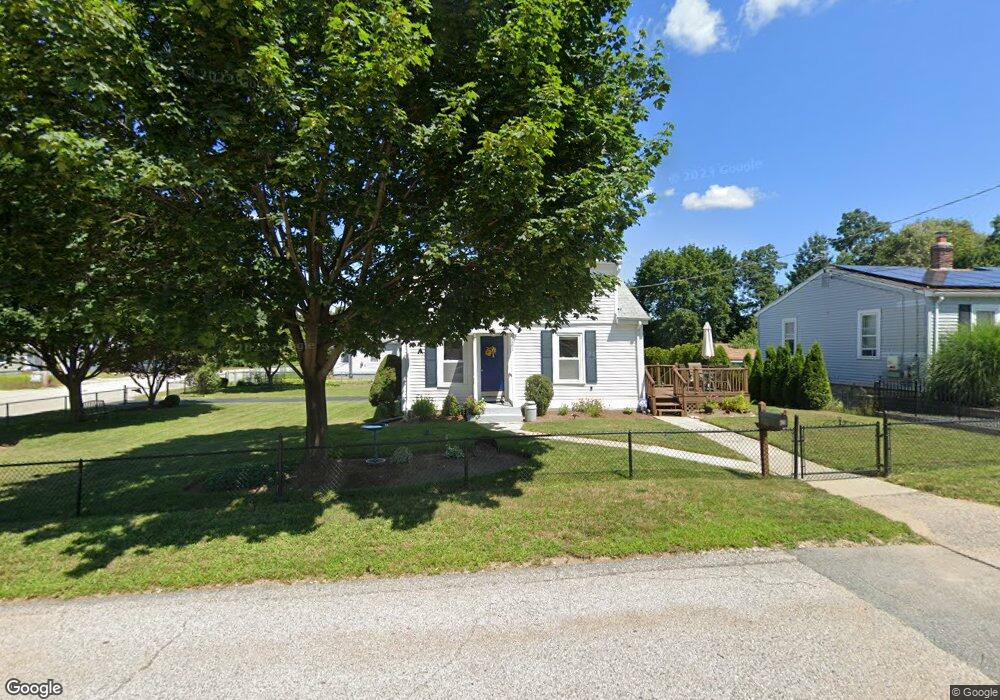
261 Norman St Woonsocket, RI 02895
East Woonsocket NeighborhoodEstimated Value: $345,000 - $369,191
3
Beds
1
Bath
1,008
Sq Ft
$357/Sq Ft
Est. Value
About This Home
This home is located at 261 Norman St, Woonsocket, RI 02895 and is currently estimated at $360,298, approximately $357 per square foot. 261 Norman St is a home located in Providence County with nearby schools including Woonsocket High School, Blackstone Valley Prep Element, and Blackstone Valley Prep High School.
Ownership History
Date
Name
Owned For
Owner Type
Purchase Details
Closed on
Jul 5, 2016
Sold by
Crawley Judith A and Bocuher Kim M
Bought by
Bocuher Kim M
Current Estimated Value
Purchase Details
Closed on
Dec 11, 2000
Sold by
Meyer Jack A and Meyer Diane M
Bought by
Crawley Judith A and Crawley Kim M
Purchase Details
Closed on
Apr 21, 1989
Sold by
Monti Joseph P
Bought by
Meyer Jack A
Create a Home Valuation Report for This Property
The Home Valuation Report is an in-depth analysis detailing your home's value as well as a comparison with similar homes in the area
Home Values in the Area
Average Home Value in this Area
Purchase History
| Date | Buyer | Sale Price | Title Company |
|---|---|---|---|
| Bocuher Kim M | -- | -- | |
| Crawley Judith A | $100,000 | -- | |
| Bocuher Kim M | -- | -- | |
| Crawley Judith A | $100,000 | -- | |
| Meyer Jack A | $106,000 | -- |
Source: Public Records
Mortgage History
| Date | Status | Borrower | Loan Amount |
|---|---|---|---|
| Previous Owner | Meyer Jack A | $50,000 | |
| Previous Owner | Meyer Jack A | $100,000 | |
| Previous Owner | Meyer Jack A | $25,000 |
Source: Public Records
Tax History
| Year | Tax Paid | Tax Assessment Tax Assessment Total Assessment is a certain percentage of the fair market value that is determined by local assessors to be the total taxable value of land and additions on the property. | Land | Improvement |
|---|---|---|---|---|
| 2025 | $3,455 | $307,700 | $107,900 | $199,800 |
| 2024 | $3,341 | $229,800 | $88,000 | $141,800 |
| 2023 | $3,213 | $229,800 | $88,000 | $141,800 |
| 2022 | $3,213 | $229,800 | $88,000 | $141,800 |
| 2021 | $3,945 | $166,100 | $70,700 | $95,400 |
| 2020 | $3,986 | $166,100 | $70,700 | $95,400 |
| 2018 | $4,000 | $166,100 | $70,700 | $95,400 |
| 2017 | $4,009 | $133,200 | $65,300 | $67,900 |
| 2016 | $4,241 | $133,200 | $65,300 | $67,900 |
| 2015 | $4,872 | $133,200 | $65,300 | $67,900 |
| 2014 | $4,694 | $130,600 | $71,900 | $58,700 |
Source: Public Records
Map
Nearby Homes
- 39 Louise St
- 202 Phillips St
- 42 Armand Ave
- 374 Thibeault Ave
- 216 Bertenshaw Rd
- 414 Rhode Island Ave
- 378 Gauthier Dr
- 375 Congress St
- 49 Poisson St
- 3 Quail St
- 0 Hillview St
- 3889 Mendon Rd
- 45 Valley View Dr
- 252 Railroad St
- 19 Marques St
- 0 Irving Lot 206 Ave Unit 1397321
- 68 Kenwood St
- 86 Branch Ave
- 59 Cooper Ave
- 0 Irving Lot 192 Ave Unit 1383138
Your Personal Tour Guide
Ask me questions while you tour the home.