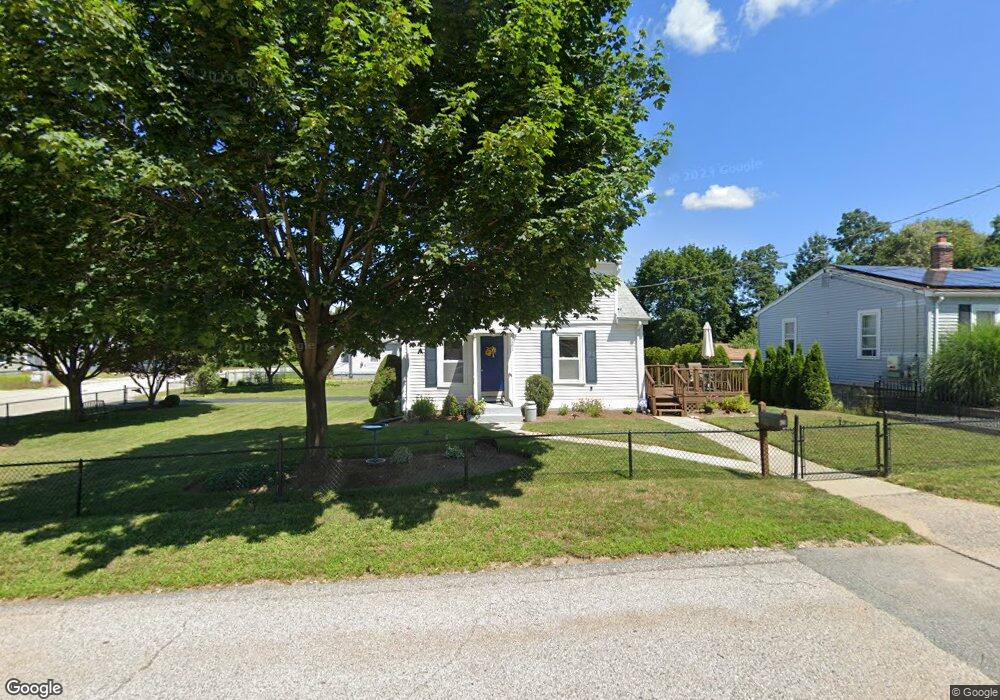
261 Norman St Woonsocket, RI 02895
East Woonsocket NeighborhoodEstimated Value: $331,000 - $363,155
About This Home
This home is located at 261 Norman St, Woonsocket, RI 02895 and is currently estimated at $352,289, approximately $349 per square foot. 261 Norman St is a home located in Providence County with nearby schools including Woonsocket High School, Blackstone Valley Prep Element, and Blackstone Valley Prep High School.
Ownership History
We collect this data history from publicly available records. To have your information removed, we recommend requesting removal directly through your county’s website.
Purchase Details
Purchase Details
Purchase Details
Home Values in the Area
Average Home Value in this Area
Purchase History
We collect this data history from publicly available records. To have your information removed, we recommend requesting removal directly through your county’s website.
| Date | Buyer | Sale Price | Title Company |
|---|---|---|---|
| -- | -- | ||
| $100,000 | -- | ||
| $106,000 | -- |
Mortgage History
We collect this data history from publicly available records. To have your information removed, we recommend requesting removal directly through your county’s website.
| Date | Status | Borrower | Loan Amount |
|---|---|---|---|
| Previous Owner | $50,000 | ||
| Previous Owner | $100,000 | ||
| Previous Owner | $25,000 | ||
| Previous Owner | $15,000 |
Tax History
We collect this data history from publicly available records. To have your information removed, we recommend requesting removal directly through your county’s website.
| Year | Tax Paid | Tax Assessment Tax Assessment Total Assessment is a certain percentage of the fair market value that is determined by local assessors to be the total taxable value of land and additions on the property. | Land | Improvement |
|---|---|---|---|---|
| 2025 | $3,455 | $307,700 | $107,900 | $199,800 |
| 2024 | $3,341 | $229,800 | $88,000 | $141,800 |
| 2023 | $3,213 | $229,800 | $88,000 | $141,800 |
| 2022 | $3,213 | $229,800 | $88,000 | $141,800 |
| 2021 | $3,945 | $166,100 | $70,700 | $95,400 |
| 2020 | $3,986 | $166,100 | $70,700 | $95,400 |
| 2018 | $4,000 | $166,100 | $70,700 | $95,400 |
| 2017 | $4,009 | $133,200 | $65,300 | $67,900 |
| 2016 | $4,241 | $133,200 | $65,300 | $67,900 |
| 2015 | $4,872 | $133,200 | $65,300 | $67,900 |
| 2014 | $4,694 | $130,600 | $71,900 | $58,700 |
Map
- 39 Louise St
- 207 Phillips St
- 264 Phillips St
- 1223 Cumberland Hill Rd
- 204 Talcott St
- 64 Lydia Ave
- 139 Danielle Dr
- 1842 Mendon Rd
- 43 Virginia Ave
- 378 Gauthier Dr
- 154 Mount Saint Charles Ave
- 375 Congress St
- 49 Poisson St
- 3 Quail St
- 0 Circle St Unit 1415893
- 413 Manville Rd
- 430 Cumberland Hill Rd
- 23 Alton Ave
- 264 Aylsworth Ave
- 3871 Mendon Rd
Ask me questions while you tour the home.