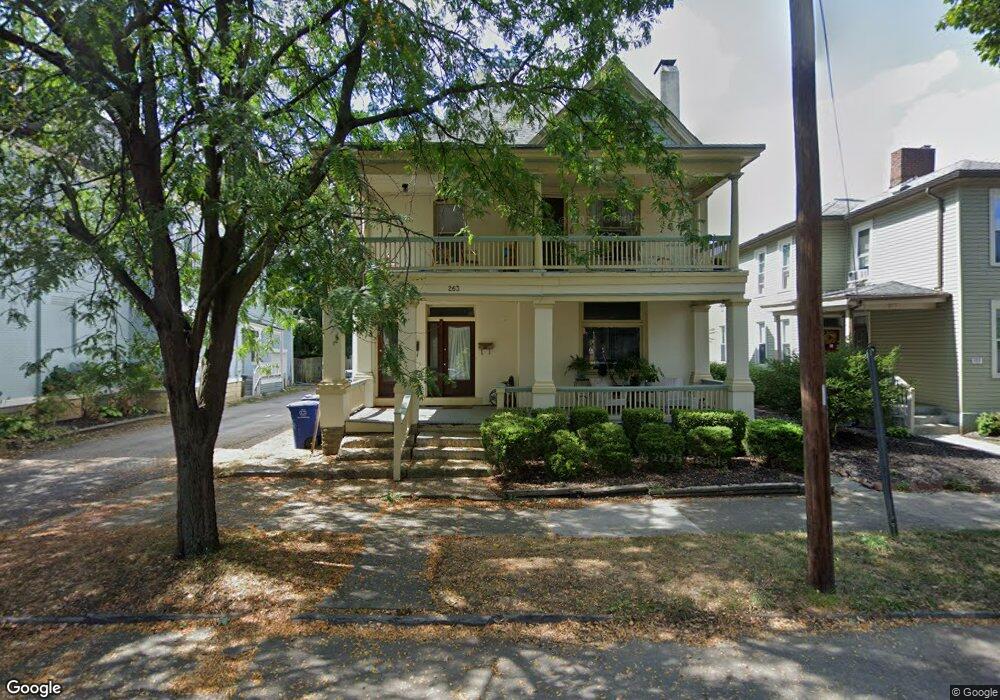
261 S 17th St Unit 2 Columbus, OH 43205
Olde Towne East NeighborhoodEstimated Value: $310,469 - $396,000
4
Beds
2
Baths
3,009
Sq Ft
$122/Sq Ft
Est. Value
About This Home
This home is located at 261 S 17th St Unit 2, Columbus, OH 43205 and is currently estimated at $366,367, approximately $121 per square foot. 261 S 17th St Unit 2 is a home located in Franklin County with nearby schools including Ohio Avenue Elementary School, Champion Middle School, and East High School.
Ownership History
Date
Name
Owned For
Owner Type
Purchase Details
Closed on
Jul 23, 2019
Sold by
Investment One Corporation Ltd
Bought by
Ote 17Th Llc
Current Estimated Value
Purchase Details
Closed on
Oct 14, 2002
Sold by
Bradford John
Bought by
Investment One Corporation Ltd
Purchase Details
Closed on
Jun 29, 2000
Sold by
Stanley John T
Bought by
Bradford John
Home Financials for this Owner
Home Financials are based on the most recent Mortgage that was taken out on this home.
Original Mortgage
$67,000
Interest Rate
9.5%
Mortgage Type
Purchase Money Mortgage
Purchase Details
Closed on
Oct 11, 1995
Sold by
Miller Nancy E
Bought by
Stanley John T
Home Financials for this Owner
Home Financials are based on the most recent Mortgage that was taken out on this home.
Original Mortgage
$71,000
Interest Rate
7.8%
Mortgage Type
FHA
Purchase Details
Closed on
Apr 1, 1987
Purchase Details
Closed on
Nov 1, 1980
Create a Home Valuation Report for This Property
The Home Valuation Report is an in-depth analysis detailing your home's value as well as a comparison with similar homes in the area
Home Values in the Area
Average Home Value in this Area
Purchase History
| Date | Buyer | Sale Price | Title Company |
|---|---|---|---|
| Ote 17Th Llc | -- | None Available | |
| Investment One Corporation Ltd | -- | -- | |
| Bradford John | $64,500 | Title First Agency Inc | |
| Stanley John T | $56,000 | -- | |
| -- | $36,000 | -- | |
| -- | $19,000 | -- |
Source: Public Records
Mortgage History
| Date | Status | Borrower | Loan Amount |
|---|---|---|---|
| Previous Owner | Bradford John | $67,000 | |
| Previous Owner | Stanley John T | $71,000 |
Source: Public Records
Tax History Compared to Growth
Tax History
| Year | Tax Paid | Tax Assessment Tax Assessment Total Assessment is a certain percentage of the fair market value that is determined by local assessors to be the total taxable value of land and additions on the property. | Land | Improvement |
|---|---|---|---|---|
| 2024 | $3,433 | $74,900 | $22,960 | $51,940 |
| 2023 | $3,390 | $74,900 | $22,960 | $51,940 |
| 2022 | $1,741 | $32,760 | $1,750 | $31,010 |
| 2021 | $1,744 | $32,760 | $1,750 | $31,010 |
| 2020 | $1,747 | $32,760 | $1,750 | $31,010 |
| 2019 | $1,698 | $27,300 | $1,470 | $25,830 |
| 2018 | $1,475 | $27,300 | $1,470 | $25,830 |
| 2017 | $1,697 | $27,300 | $1,470 | $25,830 |
| 2016 | $1,380 | $20,310 | $3,330 | $16,980 |
| 2015 | $1,256 | $20,310 | $3,330 | $16,980 |
| 2014 | $1,259 | $20,310 | $3,330 | $16,980 |
| 2013 | $653 | $21,350 | $3,500 | $17,850 |
Source: Public Records
Map
Nearby Homes
- 269 S 17th St
- 828 E Main St
- 240-242 S 18th St
- 847 Franklin Ave
- 308 Carpenter St
- 143 S Garfield Ave
- 263 S 20th St
- 977 Bryden Rd
- 940 Mcallister Ave
- 891 E Mound St
- 947 Mcallister Ave
- 972 Franklin Ave
- 955 E Mound St
- 1033-1035 Franklin Ave
- 0 Carpenter St
- 581 E Walnut St
- 452 Gilbert St
- 1084 Bryden Rd Unit 9
- 322-324 S Ohio Ave
- 233 S Ohio Ave Unit 11
- 261 S 17th St Unit 263
- 255 S 17th St
- 249 S 17th St
- 273 S 17th St
- 244 S Monroe Ave
- 254 S Monroe Ave
- 283 S 17th St
- 266 S Monroe Ave
- 238 S Monroe Ave
- 262 S 17th St
- 258 S 17th St
- 270 S 17th St Unit 272
- 274 S Monroe Ave
- 231 S 17th St
- 252 S 17th St
- 276 S 17th St
- 232 S Monroe Ave Unit B
- 232 S Monroe Ave
- 248 S 17th St
- 278 S Monroe Ave