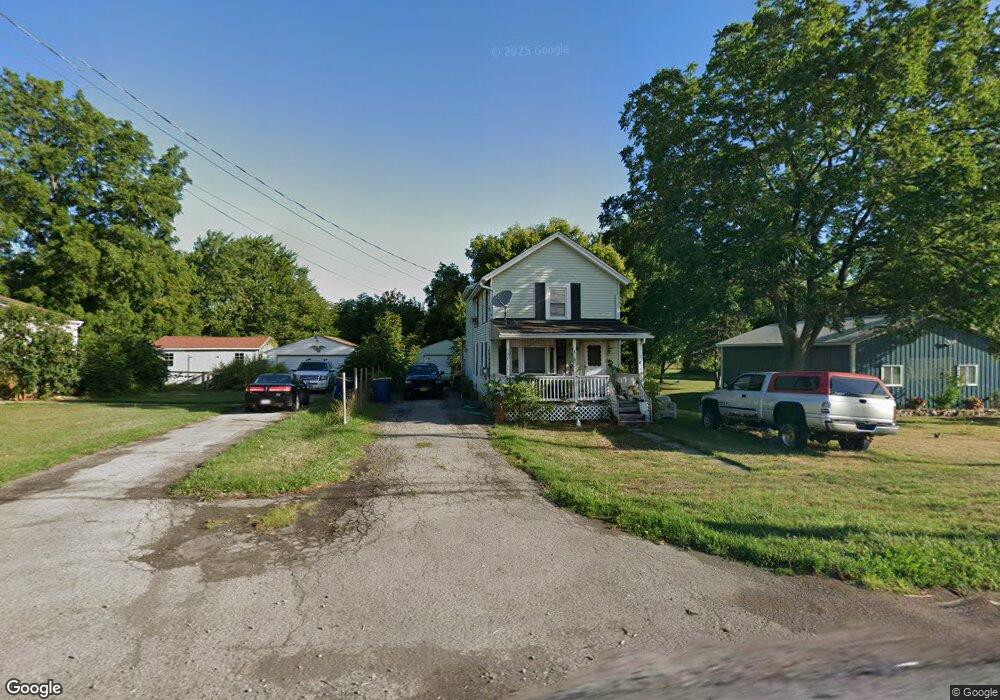
261 S Niagara St Lockport, NY 14094
Estimated Value: $161,000 - $236,000
3
Beds
1
Bath
1,706
Sq Ft
$114/Sq Ft
Est. Value
About This Home
This home is located at 261 S Niagara St, Lockport, NY 14094 and is currently estimated at $195,025, approximately $114 per square foot. 261 S Niagara St is a home located in Niagara County with nearby schools including Aaron Mossell Junior High School, Lockport High School, and DeSales Catholic School.
Ownership History
Date
Name
Owned For
Owner Type
Purchase Details
Closed on
Jan 20, 2017
Sold by
Lindemuth Christopher
Bought by
Lindemuth Christopher and Lindemuth Robert
Current Estimated Value
Purchase Details
Closed on
Jun 18, 2010
Sold by
Lewis Patrick
Bought by
Lindemuth Christopher
Home Financials for this Owner
Home Financials are based on the most recent Mortgage that was taken out on this home.
Original Mortgage
$40,168
Interest Rate
5.03%
Mortgage Type
Seller Take Back
Purchase Details
Closed on
Aug 9, 2007
Sold by
Heschke Rex
Bought by
Juhre Shawn
Purchase Details
Closed on
Aug 8, 2002
Sold by
Bank Of Ny
Bought by
Heschke Rex
Purchase Details
Closed on
Sep 12, 2001
Purchase Details
Closed on
Apr 4, 1997
Sold by
Kathke Carl
Bought by
Barney Edward and Sims Cathy
Purchase Details
Closed on
Mar 28, 1995
Create a Home Valuation Report for This Property
The Home Valuation Report is an in-depth analysis detailing your home's value as well as a comparison with similar homes in the area
Home Values in the Area
Average Home Value in this Area
Purchase History
| Date | Buyer | Sale Price | Title Company |
|---|---|---|---|
| Lindemuth Christopher | -- | None Available | |
| Lindemuth Christopher | $35,000 | None Available | |
| Juhre Shawn | $37,950 | Hogan & Willig | |
| Heschke Rex | $31,000 | Arthur E Jackson | |
| -- | -- | -- | |
| Barney Edward | $63,000 | -- | |
| -- | $5,612 | -- |
Source: Public Records
Mortgage History
| Date | Status | Borrower | Loan Amount |
|---|---|---|---|
| Closed | Lindemuth Christopher | $40,168 |
Source: Public Records
Tax History Compared to Growth
Tax History
| Year | Tax Paid | Tax Assessment Tax Assessment Total Assessment is a certain percentage of the fair market value that is determined by local assessors to be the total taxable value of land and additions on the property. | Land | Improvement |
|---|---|---|---|---|
| 2024 | $4,286 | $128,000 | $12,100 | $115,900 |
| 2023 | $4,346 | $123,000 | $12,100 | $110,900 |
| 2022 | $1,996 | $112,000 | $12,100 | $99,900 |
| 2021 | $1,606 | $56,600 | $5,400 | $51,200 |
| 2020 | $1,486 | $56,600 | $5,400 | $51,200 |
| 2019 | $835 | $56,600 | $5,400 | $51,200 |
| 2018 | $862 | $56,600 | $5,400 | $51,200 |
| 2017 | $835 | $56,600 | $5,400 | $51,200 |
| 2016 | $758 | $56,600 | $5,400 | $51,200 |
| 2015 | -- | $56,600 | $5,400 | $51,200 |
| 2014 | -- | $56,600 | $5,400 | $51,200 |
Source: Public Records
Map
Nearby Homes