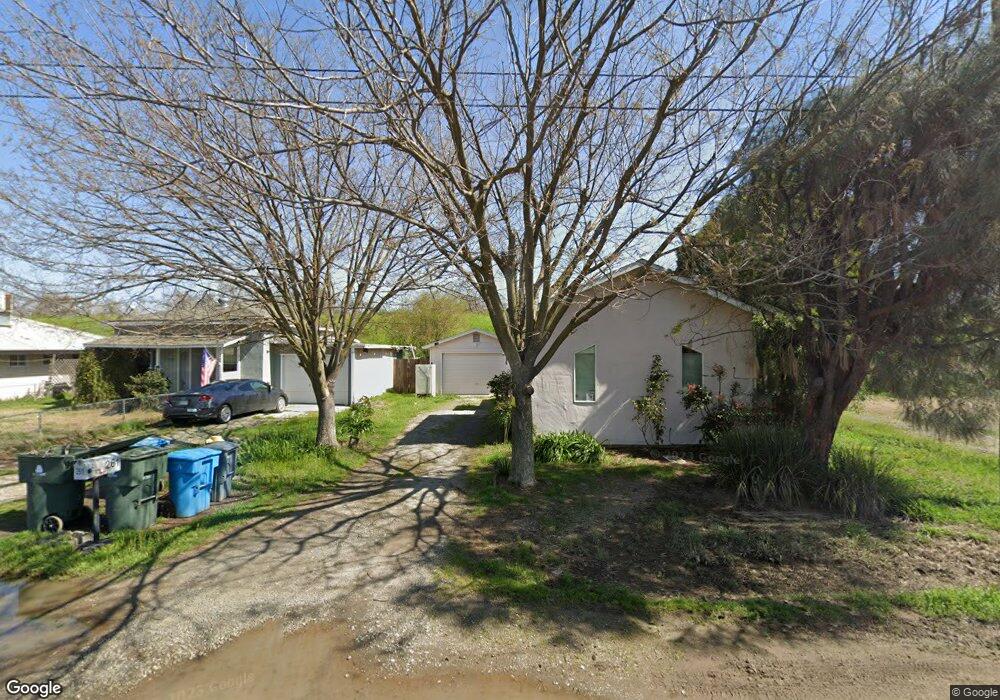
261 Second St Yuba City, CA 95991
Central City NeighborhoodEstimated Value: $190,000 - $230,071
1
Bed
1
Bath
640
Sq Ft
$334/Sq Ft
Est. Value
About This Home
This home is located at 261 Second St, Yuba City, CA 95991 and is currently estimated at $213,518, approximately $333 per square foot. 261 Second St is a home located in Sutter County with nearby schools including Bridge Street Elementary School, Gray Avenue Middle School, and River Valley High School.
Ownership History
Date
Name
Owned For
Owner Type
Purchase Details
Closed on
May 19, 2009
Sold by
American Home Mortgage Servicing Inc
Bought by
Hodges Geneva
Current Estimated Value
Home Financials for this Owner
Home Financials are based on the most recent Mortgage that was taken out on this home.
Original Mortgage
$48,995
Outstanding Balance
$30,923
Interest Rate
4.83%
Mortgage Type
FHA
Estimated Equity
$182,595
Purchase Details
Closed on
Dec 10, 2008
Sold by
Desai Pravesh
Bought by
American Home Mortgage Servicing Inc
Purchase Details
Closed on
Mar 18, 2005
Sold by
Stratton Barbara T
Bought by
Desai Pravesh
Home Financials for this Owner
Home Financials are based on the most recent Mortgage that was taken out on this home.
Original Mortgage
$101,850
Interest Rate
6.25%
Mortgage Type
Stand Alone First
Create a Home Valuation Report for This Property
The Home Valuation Report is an in-depth analysis detailing your home's value as well as a comparison with similar homes in the area
Home Values in the Area
Average Home Value in this Area
Purchase History
| Date | Buyer | Sale Price | Title Company |
|---|---|---|---|
| Hodges Geneva | $50,000 | Fidelity National Title | |
| American Home Mortgage Servicing Inc | $145,645 | Accommodation | |
| Desai Pravesh | $145,500 | First American Title Co | |
| Desai Pravesh | -- | First American Title Co |
Source: Public Records
Mortgage History
| Date | Status | Borrower | Loan Amount |
|---|---|---|---|
| Open | Hodges Geneva | $48,995 | |
| Previous Owner | Desai Pravesh | $101,850 | |
| Closed | Desai Pravesh | $43,650 |
Source: Public Records
Tax History Compared to Growth
Tax History
| Year | Tax Paid | Tax Assessment Tax Assessment Total Assessment is a certain percentage of the fair market value that is determined by local assessors to be the total taxable value of land and additions on the property. | Land | Improvement |
|---|---|---|---|---|
| 2025 | $1,074 | $64,241 | $25,745 | $38,496 |
| 2024 | $1,074 | $62,983 | $25,241 | $37,742 |
| 2023 | $1,074 | $61,749 | $24,747 | $37,002 |
| 2022 | $1,029 | $60,539 | $24,262 | $36,277 |
| 2021 | $1,013 | $59,366 | $23,794 | $35,572 |
| 2020 | $999 | $58,757 | $23,550 | $35,207 |
| 2019 | $976 | $57,605 | $23,088 | $34,517 |
| 2018 | $643 | $56,475 | $22,635 | $33,840 |
| 2017 | $620 | $55,368 | $22,192 | $33,176 |
| 2016 | $564 | $54,282 | $21,756 | $32,526 |
| 2015 | $554 | $53,467 | $21,430 | $32,037 |
| 2014 | $548 | $52,420 | $21,010 | $31,410 |
Source: Public Records
Map
Nearby Homes
- 307 Dorman Ave
- 409 Pine St
- 275 Moore Ave
- 430 Pine St
- 668 Sutter St Unit 40
- 668 Sutter St Unit 33
- 668 Sutter St Unit 55
- 262 Del Monte Ave
- 268 Teegarden Ave
- 626 I St
- 659 Elm St
- 570 Bridge St
- 180 Percy Ave
- 517 3rd St
- 418 Pine Way
- 551 Linden St
- 370 Pine Way
- 429 Robinson Ave
- 536 Forbes Ave
- 0 Hawthorne St