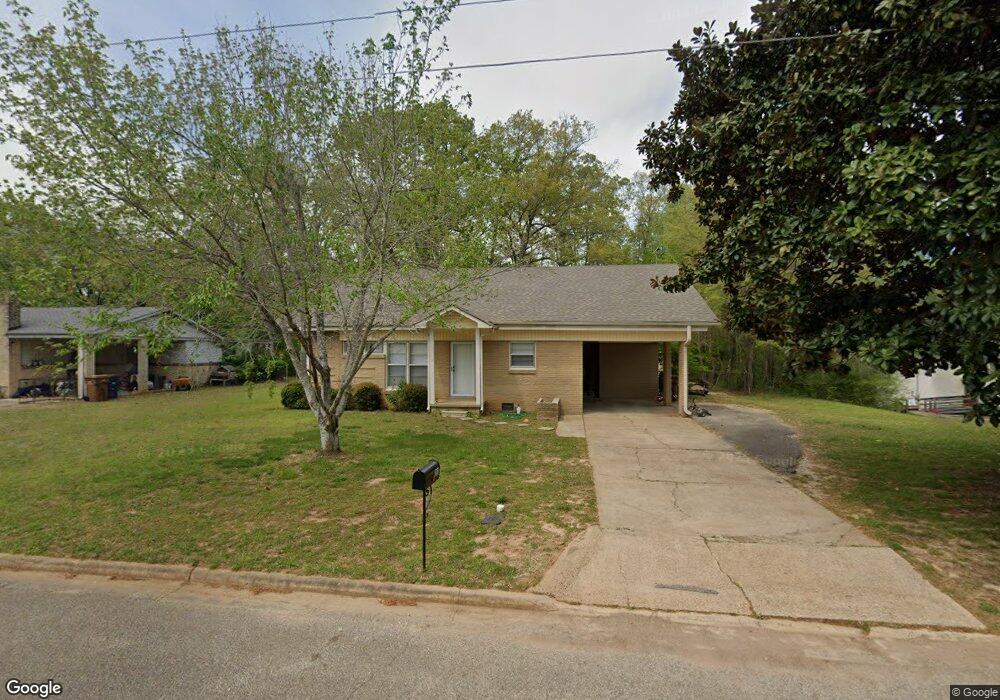
261 Thomas St Lexington, TN 38351
Estimated Value: $177,754 - $220,000
--
Bed
2
Baths
1,627
Sq Ft
$124/Sq Ft
Est. Value
About This Home
This home is located at 261 Thomas St, Lexington, TN 38351 and is currently estimated at $201,689, approximately $123 per square foot. 261 Thomas St is a home located in Henderson County with nearby schools including Paul G. Caywood Elementary School, Lexington Middle School, and Lexington Montessori Center.
Ownership History
Date
Name
Owned For
Owner Type
Purchase Details
Closed on
Jul 1, 2014
Sold by
Baker Elizabeth D
Bought by
Baker Gina B
Current Estimated Value
Purchase Details
Closed on
Apr 14, 2005
Sold by
Harold Renfroe
Bought by
David Bledsoe
Purchase Details
Closed on
Oct 3, 1997
Sold by
Wayne Davidson Timothy
Bought by
Baker Eliabeth D
Purchase Details
Closed on
Dec 31, 1996
Sold by
Charles Foshee
Bought by
Etu Davidson Timothy Wayne
Purchase Details
Closed on
Aug 17, 1992
Purchase Details
Closed on
Jun 14, 1991
Bought by
Haskins Glen E and Haskins Ann M
Purchase Details
Closed on
Oct 29, 1982
Bought by
Kennedy Henry D and Kennedy Jewell
Create a Home Valuation Report for This Property
The Home Valuation Report is an in-depth analysis detailing your home's value as well as a comparison with similar homes in the area
Home Values in the Area
Average Home Value in this Area
Purchase History
| Date | Buyer | Sale Price | Title Company |
|---|---|---|---|
| Baker Gina B | -- | -- | |
| David Bledsoe | -- | -- | |
| Baker Eliabeth D | $48,000 | -- | |
| Etu Davidson Timothy Wayne | $49,500 | -- | |
| -- | $42,000 | -- | |
| Haskins Glen E | $41,500 | -- | |
| Kennedy Henry D | -- | -- |
Source: Public Records
Tax History Compared to Growth
Tax History
| Year | Tax Paid | Tax Assessment Tax Assessment Total Assessment is a certain percentage of the fair market value that is determined by local assessors to be the total taxable value of land and additions on the property. | Land | Improvement |
|---|---|---|---|---|
| 2025 | -- | $38,000 | $0 | $0 |
| 2024 | $950 | $38,000 | $3,125 | $34,875 |
| 2023 | $950 | $38,000 | $3,125 | $34,875 |
| 2022 | $675 | $19,925 | $2,000 | $17,925 |
| 2021 | $675 | $19,925 | $2,000 | $17,925 |
| 2020 | $675 | $19,925 | $2,000 | $17,925 |
| 2019 | $675 | $19,925 | $2,000 | $17,925 |
| 2018 | $582 | $16,675 | $2,000 | $14,675 |
| 2017 | $582 | $16,675 | $2,000 | $14,675 |
| 2016 | $614 | $17,025 | $2,000 | $15,025 |
| 2015 | $614 | $17,025 | $2,000 | $15,025 |
| 2014 | -- | $17,017 | $0 | $0 |
Source: Public Records
Map
Nearby Homes