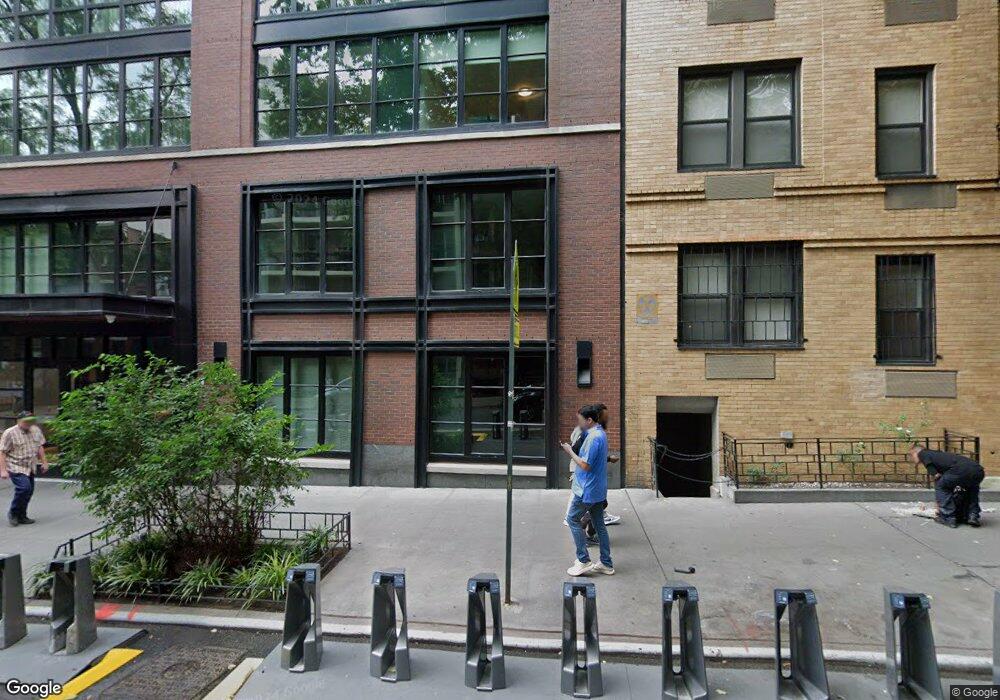
261 W 25th St Unit GRDND New York, NY 10001
Chelsea NeighborhoodEstimated Value: $2,036,000 - $2,967,000
--
Bed
--
Bath
1,329
Sq Ft
$1,974/Sq Ft
Est. Value
About This Home
This home is located at 261 W 25th St Unit GRDND, New York, NY 10001 and is currently estimated at $2,623,413, approximately $1,973 per square foot. 261 W 25th St Unit GRDND is a home located in New York County with nearby schools including P.S. 11 Sarah J. Garnet School, Clinton School, and Middle School 297.
Ownership History
Date
Name
Owned For
Owner Type
Purchase Details
Closed on
Mar 26, 2025
Sold by
Albert Wai Chan Trustee and Chan
Bought by
261 W25 1D Llc
Current Estimated Value
Purchase Details
Closed on
Mar 25, 2025
Sold by
Albert Wai Chan Trustee and Michael J Hausman Trustee
Bought by
Albert Wai Chan Trustee and Michael J Hausman Trustee
Purchase Details
Closed on
Nov 6, 2023
Sold by
Albert Wai Chan As Executor and Estate Of Yee Hung Debby Chan
Bought by
Albert Wai Chan As Trustee and Chan Bypass Trust
Purchase Details
Closed on
Apr 21, 2016
Sold by
261 Owner Llc and % The Naftali Group Llc
Bought by
Seibold Julie and Seibold Terrence
Purchase Details
Closed on
Jan 24, 2016
Sold by
Seibold Julie and Seibold Terrence
Bought by
Chan Michelle and Chan Yee Hung
Home Financials for this Owner
Home Financials are based on the most recent Mortgage that was taken out on this home.
Original Mortgage
$1,830,000
Interest Rate
4.16%
Mortgage Type
Purchase Money Mortgage
Create a Home Valuation Report for This Property
The Home Valuation Report is an in-depth analysis detailing your home's value as well as a comparison with similar homes in the area
Home Values in the Area
Average Home Value in this Area
Purchase History
| Date | Buyer | Sale Price | Title Company |
|---|---|---|---|
| 261 W25 1D Llc | -- | -- | |
| Albert Wai Chan Trustee | -- | -- | |
| Albert Wai Chan As Trustee | -- | -- | |
| Seibold Julie | $2,591,446 | -- | |
| Chan Michelle | $3,050,000 | -- |
Source: Public Records
Mortgage History
| Date | Status | Borrower | Loan Amount |
|---|---|---|---|
| Previous Owner | Chan Michelle | $1,830,000 |
Source: Public Records
Tax History Compared to Growth
Tax History
| Year | Tax Paid | Tax Assessment Tax Assessment Total Assessment is a certain percentage of the fair market value that is determined by local assessors to be the total taxable value of land and additions on the property. | Land | Improvement |
|---|---|---|---|---|
| 2025 | $33,238 | $273,301 | $63,074 | $210,227 |
| 2024 | $33,238 | $265,860 | $63,075 | $202,786 |
| 2023 | $31,903 | $265,034 | $63,074 | $201,960 |
| 2022 | $32,445 | $279,684 | $63,074 | $216,610 |
| 2021 | $30,906 | $251,941 | $63,074 | $188,867 |
| 2020 | $33,093 | $286,275 | $63,074 | $223,201 |
| 2019 | $28,653 | $278,423 | $63,074 | $215,349 |
| 2017 | $39,470 | $362,785 | $63,074 | $299,711 |
| 2016 | $54,616 | $446,407 | $63,074 | $383,333 |
Source: Public Records
Map
Nearby Homes
- 262 W 25th St
- 254 W 25th St Unit 2C
- 254 W 25th St Unit 3A
- 261 W 25th St Unit 9B
- 261 W 25th St Unit 1D
- 261 W 25th St Unit GARDENC
- 261 W 25th St Unit 2D
- 261 W 25th St Unit 4D
- 245 W 24th St Unit GARDEN
- 250 W 24th St Unit 1-CW
- 236 W 26th St Unit 2 E
- 255 W 23rd St Unit 4HW
- 255 W 23rd St Unit 5B
- 255 W 23rd St Unit 5GW
- 225 W 25th St Unit 4B
- 225 W 25th St Unit 2H
- 252 7th Ave Unit 9D
- 252 7th Ave Unit 9R
- 252 7th Ave Unit 15N
- 252 7th Ave Unit 7K
- 261 W 25th St Unit 1C
- 261 W 25th St
- 261 W 25th St Unit 4NE
- 261 W 25th St Unit GRDNB
- 261 W 25th St Unit 8B
- 261 W 25th St Unit Penthouse B
- 261 W 25th St Unit GRDN-C
- 261 W 25th St Unit 7BPH
- 261 W 25th St Unit 3D
- 261 W 25th St Unit 5B
- 261 W 25th St Unit 6B
- 261 W 25th St Unit 6D
- 261 W 25th St Unit 8A
- 261 W 25th St Unit 8D
- 261 W 25th St Unit PHB
- 261 W 25th St Unit 5A
- 261 W 25th St Unit 3B
- 261 W 25th St Unit 7E
- 261 W 25th St Unit 10B
- 261 W 25th St Unit 10A