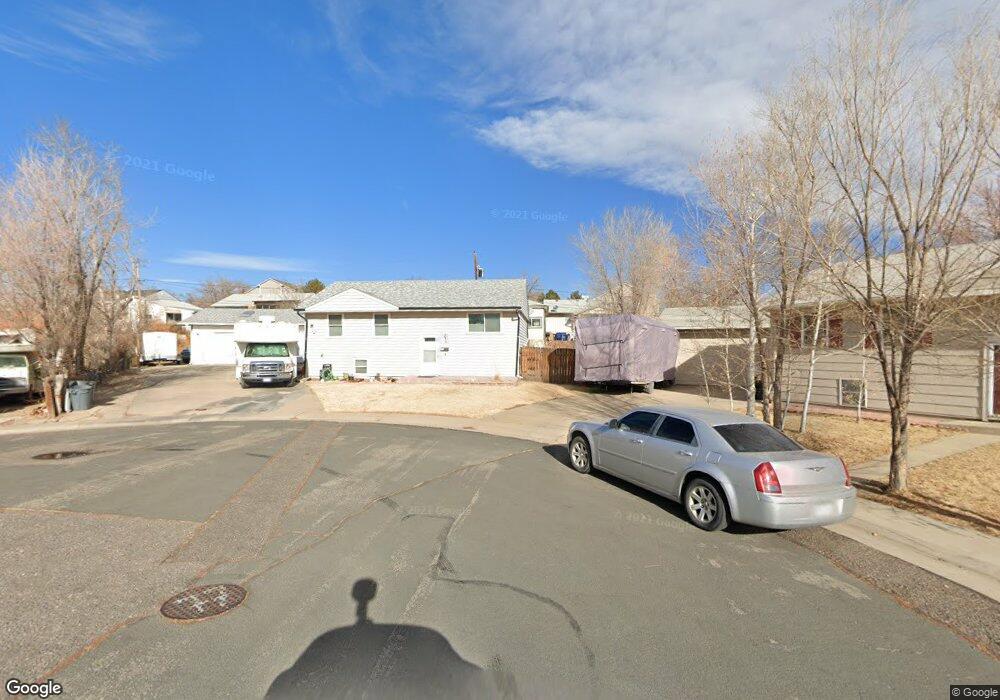
261 W 79th Ct Denver, CO 80221
Sherrelwood NeighborhoodEstimated Value: $443,000 - $453,610
2
Beds
1
Bath
1,887
Sq Ft
$237/Sq Ft
Est. Value
About This Home
This home is located at 261 W 79th Ct, Denver, CO 80221 and is currently estimated at $447,653, approximately $237 per square foot. 261 W 79th Ct is a home located in Adams County with nearby schools including Trailside Academy, The Pinnacle Charter School Elementary, and The Pinnacle Charter School High School.
Ownership History
Date
Name
Owned For
Owner Type
Purchase Details
Closed on
Mar 20, 2014
Sold by
Mozingo Shaunna D
Bought by
Mozingo Robert A
Current Estimated Value
Purchase Details
Closed on
Jun 29, 2006
Sold by
Smith Scott A and Smith Pauline L
Bought by
Mozingo Shaunna D and Monzingo Robert A
Home Financials for this Owner
Home Financials are based on the most recent Mortgage that was taken out on this home.
Original Mortgage
$177,493
Outstanding Balance
$105,257
Interest Rate
6.63%
Mortgage Type
FHA
Estimated Equity
$342,396
Purchase Details
Closed on
Sep 26, 2003
Sold by
Mortgage Investments Enterprises Llc
Bought by
Smith Scott A and Smith Pauline L
Home Financials for this Owner
Home Financials are based on the most recent Mortgage that was taken out on this home.
Original Mortgage
$196,319
Interest Rate
6.24%
Mortgage Type
FHA
Purchase Details
Closed on
Apr 11, 2003
Sold by
Duran Anthony M and Duran Barbara J
Bought by
Mortgage Investments Enterprises Llc
Create a Home Valuation Report for This Property
The Home Valuation Report is an in-depth analysis detailing your home's value as well as a comparison with similar homes in the area
Home Values in the Area
Average Home Value in this Area
Purchase History
| Date | Buyer | Sale Price | Title Company |
|---|---|---|---|
| Mozingo Robert A | -- | None Available | |
| Mozingo Shaunna D | $180,000 | Fahtco | |
| Smith Scott A | $199,400 | -- | |
| Mortgage Investments Enterprises Llc | -- | -- |
Source: Public Records
Mortgage History
| Date | Status | Borrower | Loan Amount |
|---|---|---|---|
| Open | Mozingo Shaunna D | $177,493 | |
| Previous Owner | Smith Scott A | $196,319 |
Source: Public Records
Tax History Compared to Growth
Tax History
| Year | Tax Paid | Tax Assessment Tax Assessment Total Assessment is a certain percentage of the fair market value that is determined by local assessors to be the total taxable value of land and additions on the property. | Land | Improvement |
|---|---|---|---|---|
| 2024 | $2,668 | $27,060 | $5,500 | $21,560 |
| 2023 | $2,652 | $30,100 | $5,610 | $24,490 |
| 2022 | $2,681 | $25,050 | $5,770 | $19,280 |
| 2021 | $2,522 | $25,050 | $5,770 | $19,280 |
| 2020 | $2,234 | $22,450 | $5,930 | $16,520 |
| 2019 | $2,244 | $22,450 | $5,930 | $16,520 |
| 2018 | $1,879 | $17,750 | $5,400 | $12,350 |
| 2017 | $1,845 | $17,750 | $5,400 | $12,350 |
| 2016 | $1,512 | $14,260 | $2,950 | $11,310 |
| 2015 | $1,437 | $14,260 | $2,950 | $11,310 |
| 2014 | -- | $12,240 | $2,390 | $9,850 |
Source: Public Records
Map
Nearby Homes
- 261 Elbert Way
- 7856 Joan Dr
- 7815 Conifer Rd
- 521 W 78th Place
- 7715 Durango St
- 7950 Patricia Dr
- 700 Elbert St
- 8298 Cherokee St
- 7600 Acoma Ct
- 7609 Sherman Place
- 8271 Bluebell Way
- 8205 Pennsylvania St
- 7800 Greenwood Blvd
- 7961 Granada Rd
- 1041 Marigold Dr
- 481 Cragmore St
- 500 E 83rd Dr
- 7883 Greenwood Blvd
- 921 Dakin St
- 7973 Greenwood Blvd
- 260 W 80th Ave
- 241 W 79th Ct
- 240 W 80th Ave
- 281 W 79th Place
- 301 W 79th Place
- 280 W 80th Ave
- 220 W 80th Ave
- 221 W 79th Ct
- 321 W 79th Place
- 300 W 80th Ave
- 7985 Joan Dr
- 7975 Joan Dr
- 320 W 80th Ave
- 7995 Joan Dr
- 7965 Joan Dr
- 341 W 79th Place
- 260 W 79th Place
- 200 Elbert Way
- 320 W 79th Place
- 280 W 79th Place