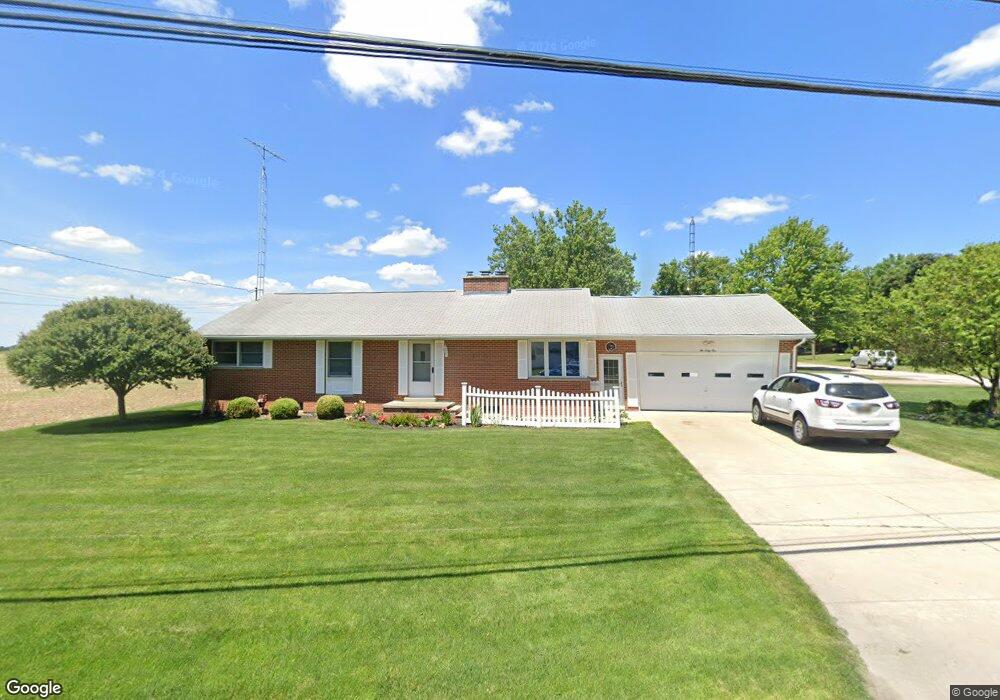
261 W Main St Shelby, OH 44875
Estimated Value: $159,000 - $209,000
3
Beds
2
Baths
1,646
Sq Ft
$116/Sq Ft
Est. Value
About This Home
This home is located at 261 W Main St, Shelby, OH 44875 and is currently estimated at $191,037, approximately $116 per square foot. 261 W Main St is a home located in Richland County with nearby schools including St. Mary's School.
Ownership History
Date
Name
Owned For
Owner Type
Purchase Details
Closed on
Apr 29, 2022
Sold by
Light Denise A
Bought by
Light Ashley R
Current Estimated Value
Home Financials for this Owner
Home Financials are based on the most recent Mortgage that was taken out on this home.
Original Mortgage
$141,279
Interest Rate
6.31%
Mortgage Type
FHA
Purchase Details
Closed on
Nov 26, 2012
Sold by
Light Sally Ann
Bought by
Light Denise A
Create a Home Valuation Report for This Property
The Home Valuation Report is an in-depth analysis detailing your home's value as well as a comparison with similar homes in the area
Home Values in the Area
Average Home Value in this Area
Purchase History
| Date | Buyer | Sale Price | Title Company |
|---|---|---|---|
| Light Ashley R | $150,000 | -- | |
| Light Denise A | -- | Attorney |
Source: Public Records
Mortgage History
| Date | Status | Borrower | Loan Amount |
|---|---|---|---|
| Previous Owner | Light Ashley R | $141,279 |
Source: Public Records
Tax History Compared to Growth
Tax History
| Year | Tax Paid | Tax Assessment Tax Assessment Total Assessment is a certain percentage of the fair market value that is determined by local assessors to be the total taxable value of land and additions on the property. | Land | Improvement |
|---|---|---|---|---|
| 2024 | $1,737 | $45,460 | $5,460 | $40,000 |
| 2023 | $1,737 | $45,460 | $5,460 | $40,000 |
| 2022 | $1,851 | $43,340 | $5,520 | $37,820 |
| 2021 | $1,478 | $43,340 | $5,520 | $37,820 |
| 2020 | $1,479 | $43,340 | $5,520 | $37,820 |
| 2019 | $1,305 | $36,730 | $4,680 | $32,050 |
| 2018 | $1,292 | $36,730 | $4,680 | $32,050 |
| 2017 | $1,307 | $36,730 | $4,680 | $32,050 |
| 2016 | $1,334 | $38,110 | $4,450 | $33,660 |
| 2015 | $1,334 | $38,110 | $4,450 | $33,660 |
| 2014 | $1,282 | $38,110 | $4,450 | $33,660 |
| 2012 | $630 | $38,110 | $4,680 | $33,430 |
Source: Public Records
Map
Nearby Homes