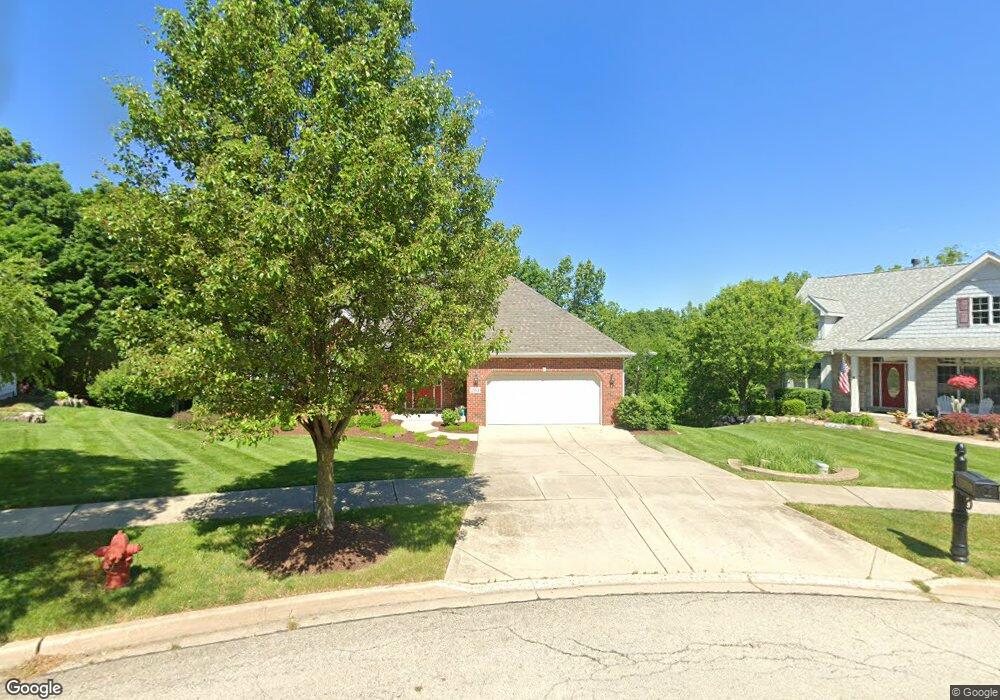
261 Windham Cir Yorkville, IL 60560
Estimated Value: $472,000 - $506,000
3
Beds
3
Baths
1,869
Sq Ft
$262/Sq Ft
Est. Value
About This Home
This home is located at 261 Windham Cir, Yorkville, IL 60560 and is currently estimated at $488,791, approximately $261 per square foot. 261 Windham Cir is a home located in Kendall County with nearby schools including Circle Center Grade School, Yorkville Intermediate School, and Yorkville Middle School.
Ownership History
Date
Name
Owned For
Owner Type
Purchase Details
Closed on
Dec 13, 2004
Sold by
Cardinal Homes Of Illinois Inc
Bought by
Nelson Daniel O and Mccullough Sheila
Current Estimated Value
Home Financials for this Owner
Home Financials are based on the most recent Mortgage that was taken out on this home.
Original Mortgage
$280,000
Outstanding Balance
$141,250
Interest Rate
5.84%
Mortgage Type
Purchase Money Mortgage
Estimated Equity
$347,541
Purchase Details
Closed on
Jul 21, 2004
Sold by
S&K Development Llc
Bought by
Cardinal Homes Of Illinois Inc
Home Financials for this Owner
Home Financials are based on the most recent Mortgage that was taken out on this home.
Original Mortgage
$289,900
Interest Rate
6.4%
Mortgage Type
Purchase Money Mortgage
Create a Home Valuation Report for This Property
The Home Valuation Report is an in-depth analysis detailing your home's value as well as a comparison with similar homes in the area
Home Values in the Area
Average Home Value in this Area
Purchase History
| Date | Buyer | Sale Price | Title Company |
|---|---|---|---|
| Nelson Daniel O | $371,000 | First American Title | |
| Cardinal Homes Of Illinois Inc | $128,000 | First American Title |
Source: Public Records
Mortgage History
| Date | Status | Borrower | Loan Amount |
|---|---|---|---|
| Open | Nelson Daniel O | $280,000 | |
| Previous Owner | Cardinal Homes Of Illinois Inc | $289,900 |
Source: Public Records
Tax History Compared to Growth
Tax History
| Year | Tax Paid | Tax Assessment Tax Assessment Total Assessment is a certain percentage of the fair market value that is determined by local assessors to be the total taxable value of land and additions on the property. | Land | Improvement |
|---|---|---|---|---|
| 2024 | $11,184 | $141,249 | $12,756 | $128,493 |
| 2023 | $10,658 | $125,673 | $12,628 | $113,045 |
| 2022 | $10,658 | $116,352 | $16,140 | $100,212 |
| 2021 | $11,386 | $121,050 | $16,140 | $104,910 |
| 2020 | $5,589 | $116,666 | $16,108 | $100,558 |
| 2019 | $10,852 | $111,213 | $15,776 | $95,437 |
| 2018 | $10,696 | $107,565 | $15,776 | $91,789 |
| 2017 | $10,679 | $104,681 | $15,353 | $89,328 |
| 2016 | $10,564 | $100,741 | $14,928 | $85,813 |
| 2015 | $10,411 | $95,153 | $14,653 | $80,500 |
| 2014 | -- | $91,438 | $17,853 | $73,585 |
| 2013 | -- | $91,438 | $17,853 | $73,585 |
Source: Public Records
Map
Nearby Homes
- 232 Windham Cir
- 467 Poplar Dr
- 469 Kelly Ave
- W Fox Rd
- 664 White Oak Way
- 1023 S Carly Cir
- 510 W Dolph St Unit 2
- 906 N Carly Cir
- 705 State St
- 807 State St
- 403 W Somonauk St
- 1409 White Pine Ct
- 1451 Aspen Ln
- 1542 Stoneridge Ct
- 1544 Stoneridge Ct Unit 3
- 1506 Cottonwood Trail
- 1012 Independence Blvd
- 9211 Illinois 126
- 1517 Stoneridge Ct Unit 3
- Lot 11 Ashley Ln
- 267 Windham Cir
- 255 Windham Cir
- 273 Windham Cir
- 249 Windham Cir
- 279 Windham Cir
- 243 Windham Cir
- 285 Windham Cir
- 237 Windham Cir
- 244 Windham Cir
- 291 Windham Cir
- 238 Windham Cir
- 297 Windham Cir
- 225 Windham Cir
- 967 Stony Creek Ln
- 226 Windham Cir
- 303 Windham Cir
- 953 Stony Creek Ln
- 221 Windham Cir
- 309 Windham Cir
- 937 Stony Creek Ln