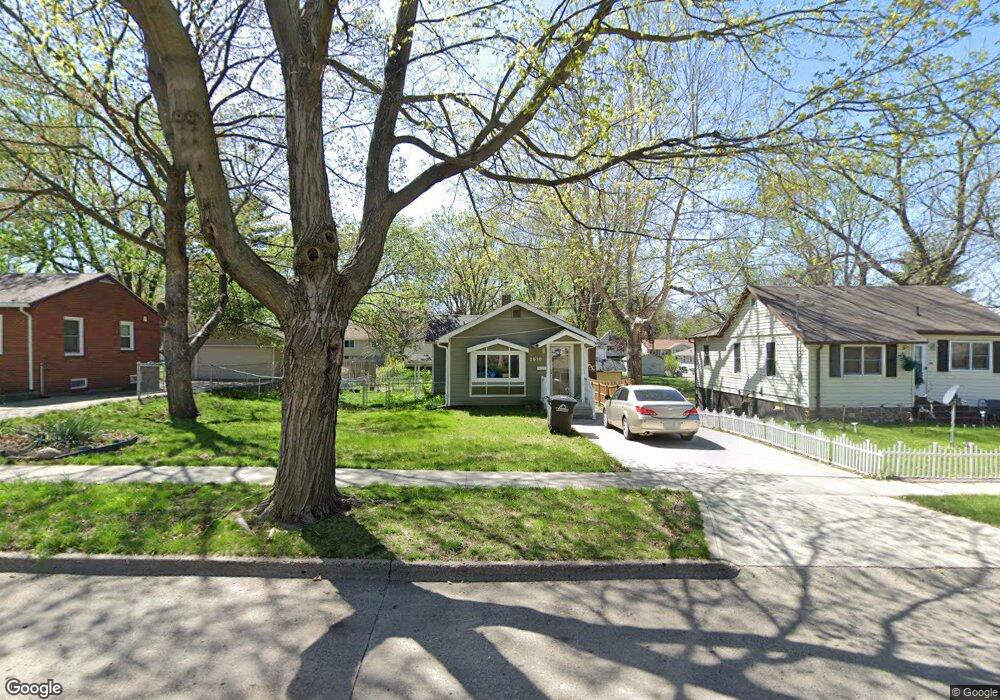
2610 61st St Des Moines, IA 50322
Merle Hay NeighborhoodEstimated Value: $167,000 - $226,000
3
Beds
1
Bath
716
Sq Ft
$274/Sq Ft
Est. Value
About This Home
This home is located at 2610 61st St, Des Moines, IA 50322 and is currently estimated at $195,955, approximately $273 per square foot. 2610 61st St is a home located in Polk County with nearby schools including Hillis Elementary School, Meredith Middle School, and Hoover High School.
Ownership History
Date
Name
Owned For
Owner Type
Purchase Details
Closed on
Mar 8, 2023
Sold by
Neff Bradley N
Bought by
Frette Broc R and Frette Craig
Current Estimated Value
Home Financials for this Owner
Home Financials are based on the most recent Mortgage that was taken out on this home.
Original Mortgage
$118,750
Outstanding Balance
$114,881
Interest Rate
6.12%
Mortgage Type
New Conventional
Estimated Equity
$81,074
Purchase Details
Closed on
Jul 9, 2007
Sold by
Neff Colleen Louise
Bought by
Neff Colleen Louise and Neff Bradley Neil
Create a Home Valuation Report for This Property
The Home Valuation Report is an in-depth analysis detailing your home's value as well as a comparison with similar homes in the area
Home Values in the Area
Average Home Value in this Area
Purchase History
| Date | Buyer | Sale Price | Title Company |
|---|---|---|---|
| Frette Broc R | $125,000 | -- | |
| Frette Broc R | $125,000 | None Listed On Document | |
| Neff Colleen Louise | -- | None Available |
Source: Public Records
Mortgage History
| Date | Status | Borrower | Loan Amount |
|---|---|---|---|
| Open | Frette Broc R | $118,750 | |
| Closed | Frette Broc R | $118,750 |
Source: Public Records
Tax History Compared to Growth
Tax History
| Year | Tax Paid | Tax Assessment Tax Assessment Total Assessment is a certain percentage of the fair market value that is determined by local assessors to be the total taxable value of land and additions on the property. | Land | Improvement |
|---|---|---|---|---|
| 2025 | $3,176 | $177,900 | $50,200 | $127,700 |
| 2024 | $3,176 | $161,400 | $45,400 | $116,000 |
| 2023 | $2,996 | $161,400 | $45,400 | $116,000 |
| 2022 | $2,972 | $136,000 | $39,500 | $96,500 |
| 2021 | $2,894 | $136,000 | $39,500 | $96,500 |
| 2020 | $3,002 | $124,600 | $36,000 | $88,600 |
| 2019 | $2,800 | $124,600 | $36,000 | $88,600 |
| 2018 | $2,766 | $112,700 | $31,700 | $81,000 |
| 2017 | $2,532 | $112,700 | $31,700 | $81,000 |
| 2016 | $2,460 | $102,100 | $28,300 | $73,800 |
| 2015 | $2,460 | $102,100 | $28,300 | $73,800 |
| 2014 | $2,346 | $100,500 | $27,300 | $73,200 |
Source: Public Records
Map
Nearby Homes
- 2621 60th St
- 2325 61st St
- 2615 59th St
- 2610 Westover Blvd
- 5820 Urbandale Ave
- 2729 67th St
- 6700 Sheridan Ave
- 5616 New York Ave
- 2002 60th St
- 3116 61st St
- 5722 Lincoln Ave
- 5521 Sheridan Ave
- 2708 68th St
- 1917 59th St
- 6316 Clearview Cir
- 2800 54th St
- 6620 Boston Ave
- 3320 61st St
- 3101 56th St
- 7005 Sheridan Cir