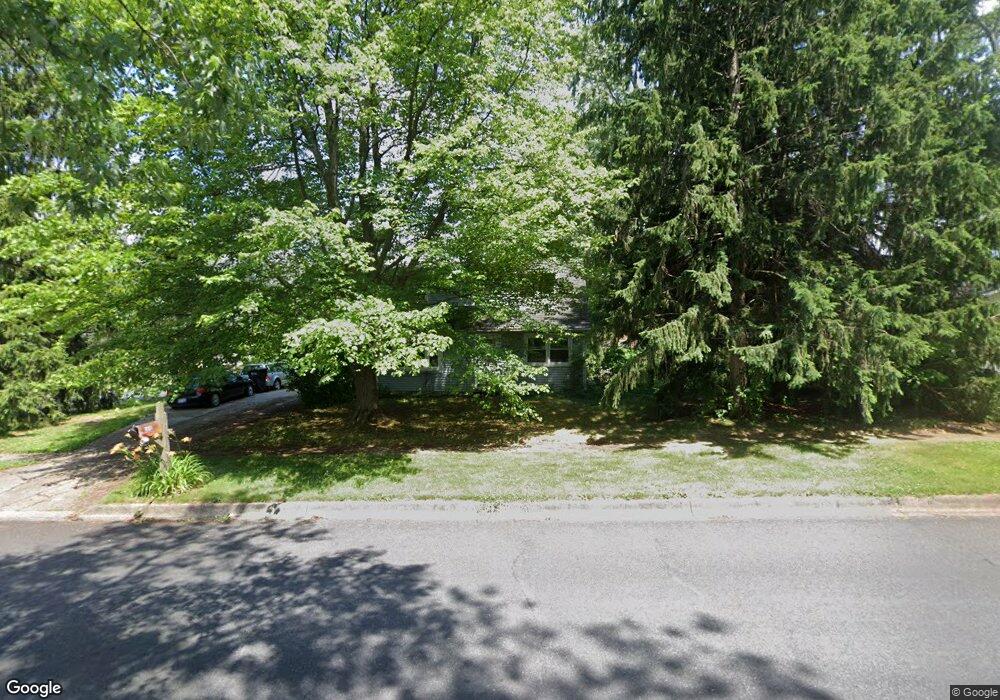
2610 Chaparral St Kalamazoo, MI 49006
Westwood NeighborhoodEstimated Value: $180,000 - $272,000
4
Beds
2
Baths
1,524
Sq Ft
$152/Sq Ft
Est. Value
About This Home
This home is located at 2610 Chaparral St, Kalamazoo, MI 49006 and is currently estimated at $231,573, approximately $151 per square foot. 2610 Chaparral St is a home located in Kalamazoo County with nearby schools including Indian Prairie Elementary School, King-Westwood Elementary School, and Hillside Middle School.
Ownership History
Date
Name
Owned For
Owner Type
Purchase Details
Closed on
Mar 15, 2007
Sold by
Norg Paul
Bought by
Wells Fargo Bank Na and First Franklin Mortgage Loan Trust 2004-
Current Estimated Value
Purchase Details
Closed on
Dec 15, 2005
Sold by
Norg Paul J
Bought by
Gordon Denise A and Gordon Matthew W
Home Financials for this Owner
Home Financials are based on the most recent Mortgage that was taken out on this home.
Original Mortgage
$107,000
Interest Rate
8%
Mortgage Type
Seller Take Back
Purchase Details
Closed on
Dec 22, 2003
Sold by
Decker Pamela K and Riggins Brian L
Bought by
Norg Paul
Home Financials for this Owner
Home Financials are based on the most recent Mortgage that was taken out on this home.
Original Mortgage
$95,000
Interest Rate
8%
Mortgage Type
Stand Alone First
Purchase Details
Closed on
Jul 3, 2003
Sold by
Riggins Brian L and Riggins Rene L
Bought by
Citifinancial Mortgage Co and Assciates Home Equity Services Inc
Create a Home Valuation Report for This Property
The Home Valuation Report is an in-depth analysis detailing your home's value as well as a comparison with similar homes in the area
Home Values in the Area
Average Home Value in this Area
Purchase History
| Date | Buyer | Sale Price | Title Company |
|---|---|---|---|
| Wells Fargo Bank Na | $105,774 | None Available | |
| Gordon Denise A | $107,010 | None Available | |
| Norg Paul | $95,000 | Nations Title | |
| Citifinancial Mortgage Co | $112,452 | -- |
Source: Public Records
Mortgage History
| Date | Status | Borrower | Loan Amount |
|---|---|---|---|
| Previous Owner | Gordon Denise A | $107,000 | |
| Previous Owner | Norg Paul | $95,000 |
Source: Public Records
Tax History Compared to Growth
Tax History
| Year | Tax Paid | Tax Assessment Tax Assessment Total Assessment is a certain percentage of the fair market value that is determined by local assessors to be the total taxable value of land and additions on the property. | Land | Improvement |
|---|---|---|---|---|
| 2025 | $2,849 | $99,300 | $0 | $0 |
| 2024 | $550 | $96,000 | $0 | $0 |
| 2023 | $524 | $81,700 | $0 | $0 |
| 2022 | $2,588 | $69,800 | $0 | $0 |
| 2021 | $2,427 | $64,700 | $0 | $0 |
| 2020 | $2,389 | $61,900 | $0 | $0 |
| 2019 | $2,283 | $60,300 | $0 | $0 |
| 2018 | $2,227 | $55,700 | $0 | $0 |
| 2017 | $0 | $55,700 | $0 | $0 |
| 2016 | -- | $52,600 | $0 | $0 |
| 2015 | -- | $47,000 | $0 | $0 |
| 2014 | -- | $40,800 | $0 | $0 |
Source: Public Records
Map
Nearby Homes
- 2205 Tamrack St
- 4643 Weston Ave
- 4637 Weston Ave
- 4763 Weston Ave
- 3472 Westhaven Trail Unit 43
- 3591 Westhaven Trail Unit 53
- 4931 Weston Ave
- 4770 Weston Ave
- 3536 Westhaven Trail Unit site 42
- 3625 Westhaven Trail Unit 54
- 3557 Westhaven Trail Unit 52
- 3598 Northfield Trail Unit 31
- 3010 Harborview Ct
- 2482 Piers End Ct
- 5339 Harborview Pass
- 2637 Piers End Ln
- 2681 W Port Dr
- 2696 Stone Valley Ln
- 3521 Meadowcroft Ave
- 1361 Cherokee St
- 2536 Chaparral St
- 4125 Sequoia Ct
- 2624 Chaparral St
- 2528 Chaparral St
- 2609 Chaparral St
- 2601 Chaparral St
- 2619 Chaparral St
- 4126 Sequoia Ct
- 4115 Sequoia Ct Unit 41154119
- 2519 Sagebrush St
- 2529 Chaparral St
- 2518 Chaparral St
- 4118 Sequoia Ct
- 2627 Chaparral St
- 2526 Sagebrush St
- 2606 Cumberland St
- 2612 Cumberland St
- 4105 Sequoia Ct
- 4106 Sequoia Ct
- 2534 Cumberland St