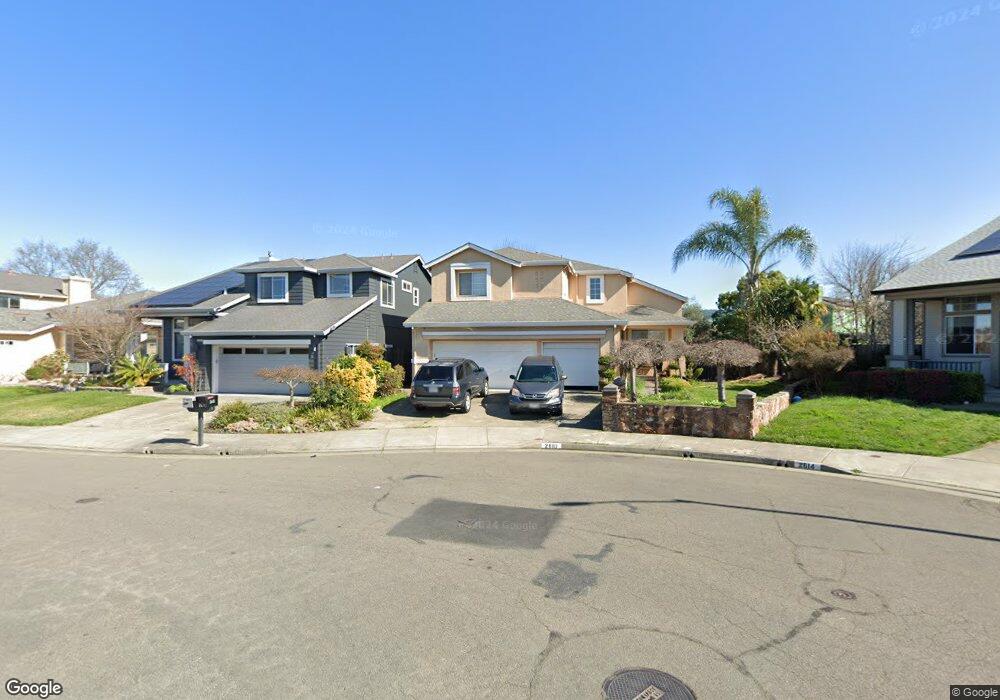
2610 Harmonica Ln Santa Rosa, CA 95407
Estimated Value: $731,471 - $810,000
4
Beds
3
Baths
2,030
Sq Ft
$374/Sq Ft
Est. Value
About This Home
This home is located at 2610 Harmonica Ln, Santa Rosa, CA 95407 and is currently estimated at $758,618, approximately $373 per square foot. 2610 Harmonica Ln is a home located in Sonoma County with nearby schools including Elsie Allen High School and St. Michael's Orthodox School.
Ownership History
Date
Name
Owned For
Owner Type
Purchase Details
Closed on
Sep 25, 2012
Sold by
Polymathic Properties Inc
Bought by
Porter Catherine Leann and Porter Revocable Living Trust
Current Estimated Value
Purchase Details
Closed on
May 9, 2012
Sold by
Farias Vargas Rafael V and Farias Vargas Elvia
Bought by
Polymathic Properties Inc
Purchase Details
Closed on
Aug 17, 2001
Sold by
Lal Shailendra H and Lal Kathryn W
Bought by
Farias Vargas Rafael V and Farias Vargas Elvia
Home Financials for this Owner
Home Financials are based on the most recent Mortgage that was taken out on this home.
Original Mortgage
$410,000
Interest Rate
7.21%
Mortgage Type
Stand Alone First
Purchase Details
Closed on
Mar 24, 1998
Sold by
Bellevue Ranch Associates Llc
Bought by
Lal Shailendra K and Lal Kathryn W
Home Financials for this Owner
Home Financials are based on the most recent Mortgage that was taken out on this home.
Original Mortgage
$164,950
Interest Rate
7.06%
Create a Home Valuation Report for This Property
The Home Valuation Report is an in-depth analysis detailing your home's value as well as a comparison with similar homes in the area
Purchase History
| Date | Buyer | Sale Price | Title Company |
|---|---|---|---|
| Porter Catherine Leann | $355,000 | Fidelity Title Company | |
| Polymathic Properties Inc | $276,500 | None Available | |
| Farias Vargas Rafael V | $410,000 | North Bay Title Co | |
| Lal Shailendra K | $220,000 | North American Title Co |
Source: Public Records
Mortgage History
| Date | Status | Borrower | Loan Amount |
|---|---|---|---|
| Previous Owner | Farias Vargas Rafael V | $410,000 | |
| Previous Owner | Lal Shailendra K | $164,950 |
Source: Public Records
Tax History
| Year | Tax Paid | Tax Assessment Tax Assessment Total Assessment is a certain percentage of the fair market value that is determined by local assessors to be the total taxable value of land and additions on the property. | Land | Improvement |
|---|---|---|---|---|
| 2025 | $4,978 | $437,147 | $174,857 | $262,290 |
| 2024 | $4,978 | $428,577 | $171,429 | $257,148 |
| 2023 | $4,978 | $420,174 | $168,068 | $252,106 |
| 2022 | $4,856 | $411,936 | $164,773 | $247,163 |
| 2021 | $4,803 | $403,860 | $161,543 | $242,317 |
| 2020 | $4,664 | $399,720 | $159,887 | $239,833 |
| 2019 | $4,606 | $391,883 | $156,752 | $235,131 |
| 2018 | $4,567 | $384,200 | $153,679 | $230,521 |
| 2017 | $4,456 | $376,667 | $150,666 | $226,001 |
| 2016 | $4,398 | $369,282 | $147,712 | $221,570 |
| 2015 | $4,259 | $363,736 | $145,494 | $218,242 |
| 2014 | $4,109 | $356,611 | $142,644 | $213,967 |
Source: Public Records
Map
Nearby Homes
- 2622 Arrowhead Dr
- 2716 Amora Cir
- Plan 2 at Grove Village
- Plan 4 at Grove Village
- Plan 5 at Grove Village
- Plan 1 at Grove Village
- Plan 6 at Grove Village
- 2733 Amora Cir
- 2912 Liscum St
- 2923 Dall Sheep Ln
- 2617 Gable St
- 2771 Sassy St
- 2774 Sassy St
- 2778 Sassy St
- 2786 Sassy St
- 671 Bellevue Ave
- 2790 Sassy St
- 2794 Sassy St
- 2623 Rosevine Ln
- 2721 Victoria Dr
- 2606 Silver Spur Dr
- 2614 Harmonica Ln
- 2024 Banjo Dr
- 2602 Silver Spur Dr
- 2028 Banjo Dr
- 2618 Harmonica Ln
- 2020 Banjo Dr
- 2032 Banjo Dr
- 2598 Silver Spur Dr
- 2621 Harmonica Ln
- 2622 Harmonica Ln
- 2036 Banjo Dr
- 2016 Banjo Dr
- 2594 Silver Spur Dr
- 2626 Harmonica Ln
- 2595 Silver Spur Dr
- 2040 Banjo Dr
- 2591 Silver Spur Dr
- 2627 Harmonica Ln
- 2013 Banjo Dr
Your Personal Tour Guide
Ask me questions while you tour the home.