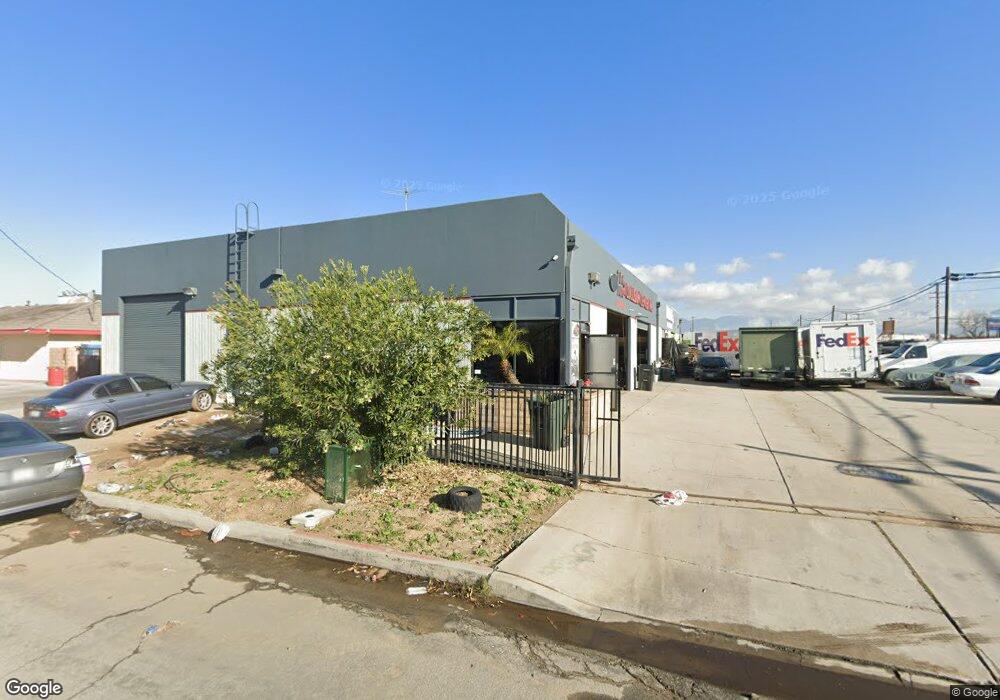
2610 S Riverside Ave Bloomington, CA 92316
Estimated Value: $1,230,054
--
Bed
--
Bath
7,200
Sq Ft
$171/Sq Ft
Est. Value
About This Home
This home is located at 2610 S Riverside Ave, Bloomington, CA 92316 and is currently estimated at $1,230,054, approximately $170 per square foot. 2610 S Riverside Ave is a home located in San Bernardino County with nearby schools including Crestmore Elementary School, Joe Baca, and Bloomington High School.
Ownership History
Date
Name
Owned For
Owner Type
Purchase Details
Closed on
Nov 10, 2023
Sold by
Coleman Lew Scott
Bought by
Scott Coleman Lew Revocable Trust and Lew
Current Estimated Value
Purchase Details
Closed on
Sep 4, 2020
Sold by
Lew Lisa Young
Bought by
Lew Chang B and Lew Scott Coleman
Purchase Details
Closed on
Apr 6, 2009
Sold by
Lew Chang B and Lew Lisa Y
Bought by
Young Lew Chang B and Young Lew Lisa
Purchase Details
Closed on
Jul 31, 2007
Sold by
Lew Chang B and Lew Lisa Y
Bought by
Chang & Lisa Lew Family Living Trust
Purchase Details
Closed on
Aug 2, 2006
Sold by
Mcgranahan Barbara
Bought by
Lew Chang B and Lew Lisa Y
Home Financials for this Owner
Home Financials are based on the most recent Mortgage that was taken out on this home.
Original Mortgage
$160,000
Interest Rate
6.56%
Mortgage Type
Commercial
Purchase Details
Closed on
Apr 21, 1997
Sold by
Larson Sharon K
Bought by
Larson Norman S
Create a Home Valuation Report for This Property
The Home Valuation Report is an in-depth analysis detailing your home's value as well as a comparison with similar homes in the area
Home Values in the Area
Average Home Value in this Area
Purchase History
| Date | Buyer | Sale Price | Title Company |
|---|---|---|---|
| Scott Coleman Lew Revocable Trust | -- | None Listed On Document | |
| Lew Chang B | -- | Accommodation | |
| Lew Chang B | -- | Accommodation | |
| Young Lew Chang B | -- | None Available | |
| Chang & Lisa Lew Family Living Trust | -- | None Available | |
| Lew Chang B | $825,000 | Ticor Title Company | |
| Larson Norman S | -- | -- |
Source: Public Records
Mortgage History
| Date | Status | Borrower | Loan Amount |
|---|---|---|---|
| Previous Owner | Lew Chang B | $160,000 |
Source: Public Records
Tax History Compared to Growth
Tax History
| Year | Tax Paid | Tax Assessment Tax Assessment Total Assessment is a certain percentage of the fair market value that is determined by local assessors to be the total taxable value of land and additions on the property. | Land | Improvement |
|---|---|---|---|---|
| 2025 | $13,111 | $1,105,330 | $200,969 | $904,361 |
| 2024 | $13,111 | $1,083,656 | $197,028 | $886,628 |
| 2023 | $13,148 | $1,062,408 | $193,165 | $869,243 |
| 2022 | $12,961 | $1,041,576 | $189,377 | $852,199 |
| 2021 | $13,408 | $1,021,153 | $185,664 | $835,489 |
| 2020 | $11,905 | $905,300 | $271,600 | $633,700 |
| 2019 | $11,143 | $854,000 | $256,200 | $597,800 |
| 2018 | $9,728 | $742,600 | $222,800 | $519,800 |
| 2017 | $8,331 | $645,792 | $193,760 | $452,032 |
| 2016 | $7,975 | $576,600 | $173,000 | $403,600 |
| 2015 | $6,637 | $500,000 | $150,000 | $350,000 |
| 2014 | $6,210 | $475,000 | $140,000 | $335,000 |
Source: Public Records
Map
Nearby Homes
- 3130 Industrial Dr
- 19585 Jurupa Ave
- 19474 Jurupa Ave
- 11317 Lilac Ave
- 10945 Trenmar Ln
- 19398 Jurupa Ave
- 11241 Cactus Ave
- 11291 Cactus Ave
- 10808 Alameda Ave
- 0 Argus Township Unit EV22013249
- 18987 Mindanao St
- 10701 Cedar Ave Unit 112
- 10701 Cedar Ave
- 10701 Cedar Ave Unit SPC 145
- 10701 Cedar Ave Unit 184
- 10701 Cedar Ave Unit 46
- 10576 Horseshoe Dr
- 18765 Jurupa Ave
- 5258 El Rivino Rd
- 636 W Pomona Ave
- 2610 S Riverside #B
- 154 W Bryant St
- 176 W Bryant St
- 150 W Santa Ana Ave
- 318 W Santa Ana Ave
- 264 W Jurupa Ave
- 2847 S Willow Ave
- 0 Jurupa Ave Unit IV18019004
- 0 Jurupa Ave Unit IV15184638
- 0 Jurupa Ave Unit IV21233840
- 2879 S Willow Ave
- 2280 S Riverside Ave
- 149 W Mindanao St
- 2437 S Lilac Ave
- 2898 S Willow Ave
- 2311 S Willow Ave
- 2733 S Vista
- 2733 S Vista
- 2733 S Vista Ave
- 322 W Jurupa Ave