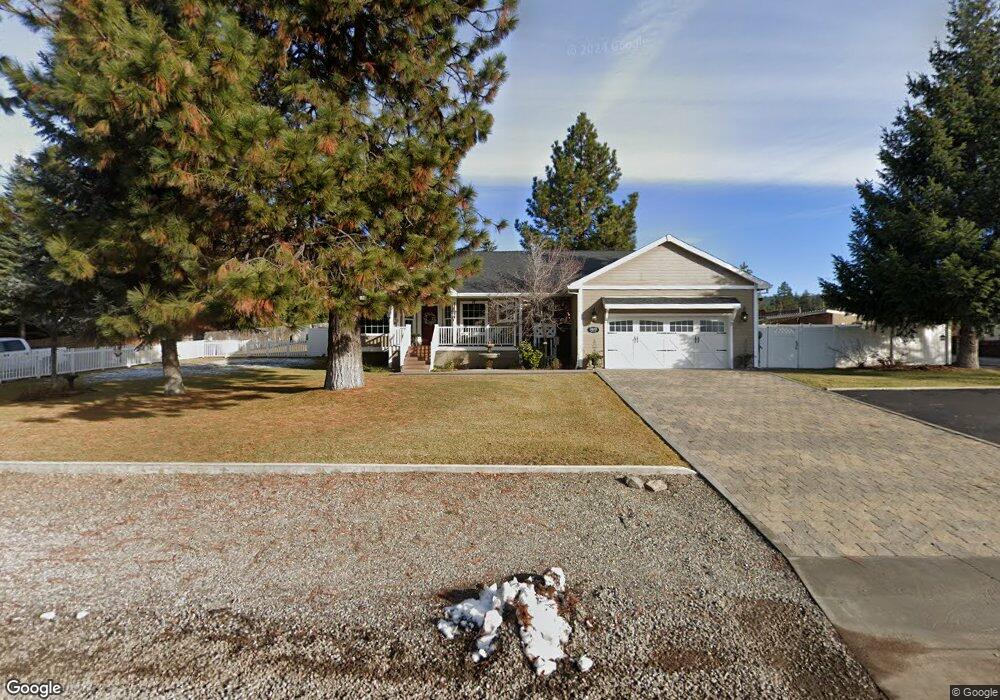
2610 Sean Way Mount Shasta, CA 96067
Estimated Value: $431,000 - $546,000
3
Beds
3
Baths
1,845
Sq Ft
$273/Sq Ft
Est. Value
About This Home
This home is located at 2610 Sean Way, Mount Shasta, CA 96067 and is currently estimated at $503,357, approximately $272 per square foot. 2610 Sean Way is a home located in Siskiyou County with nearby schools including Mt. Shasta Elementary School, Mt. Shasta High School, and Golden Eagle Charter School.
Ownership History
Date
Name
Owned For
Owner Type
Purchase Details
Closed on
Aug 2, 2016
Sold by
Bourke Jeffrey B and Bourke Catherine S
Bought by
Bourke Jeffrey B and Bourke Catherine S
Current Estimated Value
Purchase Details
Closed on
Feb 3, 2015
Sold by
Bourke Jeffrey B and Foltmer Cathy L
Bought by
Bourke Jeffrey B and Bourke Catherine S
Home Financials for this Owner
Home Financials are based on the most recent Mortgage that was taken out on this home.
Original Mortgage
$50,200
Outstanding Balance
$38,307
Interest Rate
3.66%
Mortgage Type
Credit Line Revolving
Estimated Equity
$465,050
Purchase Details
Closed on
Dec 13, 2012
Sold by
Bourke Jeffrey B
Bought by
Bourke Jeffrey B and Foltmer Cathy L
Purchase Details
Closed on
May 21, 2012
Sold by
Wells Fargo Bank Na
Bought by
Bourke Jeffrey B
Home Financials for this Owner
Home Financials are based on the most recent Mortgage that was taken out on this home.
Original Mortgage
$194,750
Outstanding Balance
$134,616
Interest Rate
3.85%
Mortgage Type
New Conventional
Estimated Equity
$368,741
Purchase Details
Closed on
Feb 2, 2012
Sold by
Davis Mary E and Davis Clyde
Bought by
Wells Fargo Bank Na
Create a Home Valuation Report for This Property
The Home Valuation Report is an in-depth analysis detailing your home's value as well as a comparison with similar homes in the area
Home Values in the Area
Average Home Value in this Area
Purchase History
| Date | Buyer | Sale Price | Title Company |
|---|---|---|---|
| Bourke Jeffrey B | -- | None Available | |
| Bourke Jeffrey B | -- | Accommodation | |
| Bourke Jeffrey B | -- | None Available | |
| Bourke Jeffrey B | $205,000 | Old Republic Title Company | |
| Wells Fargo Bank Na | $189,344 | None Available |
Source: Public Records
Mortgage History
| Date | Status | Borrower | Loan Amount |
|---|---|---|---|
| Open | Bourke Jeffrey B | $50,200 | |
| Open | Bourke Jeffrey B | $194,750 |
Source: Public Records
Tax History Compared to Growth
Tax History
| Year | Tax Paid | Tax Assessment Tax Assessment Total Assessment is a certain percentage of the fair market value that is determined by local assessors to be the total taxable value of land and additions on the property. | Land | Improvement |
|---|---|---|---|---|
| 2025 | $3,220 | $299,181 | $94,198 | $204,983 |
| 2023 | $3,220 | $287,565 | $90,541 | $197,024 |
| 2022 | $3,070 | $281,927 | $88,766 | $193,161 |
| 2021 | $3,019 | $276,400 | $87,026 | $189,374 |
| 2020 | $3,019 | $273,567 | $86,134 | $187,433 |
| 2019 | $2,964 | $268,204 | $84,446 | $183,758 |
| 2018 | $2,908 | $262,946 | $82,791 | $180,155 |
| 2017 | $2,880 | $257,791 | $81,168 | $176,623 |
| 2016 | $2,825 | $252,737 | $79,577 | $173,160 |
| 2015 | $2,749 | $245,372 | $78,382 | $166,990 |
| 2014 | $2,647 | $235,664 | $76,847 | $158,817 |
Source: Public Records
Map
Nearby Homes
- 615 Big Canyon Dr
- Lot 10 Scenic Estates Trail
- 217 Villa Rd
- Lot 7 Twin View Ct
- Lot 8 Twin View Ct
- Lot 3 Andrew Ct
- 1934 S Old Stage Rd
- Lot 15 Conestoga Ct
- Lots 9 & 10 Conestoga Ct
- 1395 Northridge Dr
- Lot 43 Deas Way Unit 3
- 527 Paul's Place
- 1501 Village Way
- 0 S Mount Shasta Blvd
- 1227 Eddy Dr
- 614 Michele Dr
- 706 Glen Mar Dr
- 00 S Mount Shasta Blvd
- Lot 1 S Old Stage Rd
- 1539 Eddy Dr