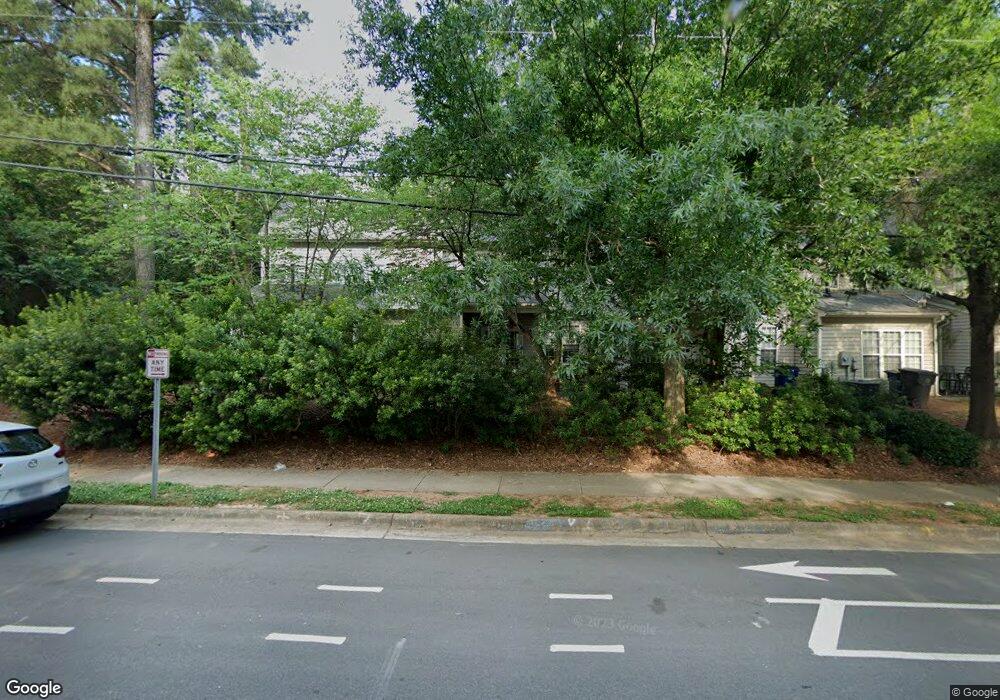
2611 Broad Oaks Place Unit 33 Raleigh, NC 27603
South Raleigh NeighborhoodEstimated Value: $290,000 - $303,000
2
Beds
3
Baths
1,272
Sq Ft
$232/Sq Ft
Est. Value
About This Home
This home is located at 2611 Broad Oaks Place Unit 33, Raleigh, NC 27603 and is currently estimated at $294,507, approximately $231 per square foot. 2611 Broad Oaks Place Unit 33 is a home located in Wake County with nearby schools including Dillard Drive Magnet Elementary School, Dillard Drive Magnet Middle School, and Longleaf School Of The Arts.
Ownership History
Date
Name
Owned For
Owner Type
Purchase Details
Closed on
Nov 6, 2014
Sold by
Potter Matthew W
Bought by
Potter Matthew W and Chiang Yahan
Current Estimated Value
Purchase Details
Closed on
Dec 27, 2010
Sold by
Hsbc Mortgage Services Inc
Bought by
Potter Matthew W
Home Financials for this Owner
Home Financials are based on the most recent Mortgage that was taken out on this home.
Original Mortgage
$104,495
Outstanding Balance
$70,557
Interest Rate
4.58%
Mortgage Type
New Conventional
Estimated Equity
$223,950
Purchase Details
Closed on
May 18, 2010
Sold by
Doplemore Michael A
Bought by
Hsbc Mortgage Services Inc
Purchase Details
Closed on
Aug 23, 2005
Sold by
Peterson Properties Llc
Bought by
Doplemore Michael A
Home Financials for this Owner
Home Financials are based on the most recent Mortgage that was taken out on this home.
Original Mortgage
$99,600
Interest Rate
6.14%
Mortgage Type
Fannie Mae Freddie Mac
Create a Home Valuation Report for This Property
The Home Valuation Report is an in-depth analysis detailing your home's value as well as a comparison with similar homes in the area
Home Values in the Area
Average Home Value in this Area
Purchase History
| Date | Buyer | Sale Price | Title Company |
|---|---|---|---|
| Potter Matthew W | -- | None Available | |
| Potter Matthew W | $110,000 | None Available | |
| Hsbc Mortgage Services Inc | $106,408 | None Available | |
| Doplemore Michael A | $124,500 | None Available |
Source: Public Records
Mortgage History
| Date | Status | Borrower | Loan Amount |
|---|---|---|---|
| Open | Potter Matthew W | $104,495 | |
| Previous Owner | Doplemore Michael A | $99,600 |
Source: Public Records
Tax History Compared to Growth
Tax History
| Year | Tax Paid | Tax Assessment Tax Assessment Total Assessment is a certain percentage of the fair market value that is determined by local assessors to be the total taxable value of land and additions on the property. | Land | Improvement |
|---|---|---|---|---|
| 2025 | $2,675 | $304,384 | $90,000 | $214,384 |
| 2024 | $2,664 | $304,384 | $90,000 | $214,384 |
| 2023 | $2,288 | $208,081 | $52,000 | $156,081 |
| 2022 | $2,127 | $208,081 | $52,000 | $156,081 |
| 2021 | $2,045 | $208,081 | $52,000 | $156,081 |
| 2020 | $2,008 | $208,081 | $52,000 | $156,081 |
| 2019 | $1,656 | $141,188 | $22,000 | $119,188 |
| 2018 | $1,563 | $141,188 | $22,000 | $119,188 |
| 2017 | $1,489 | $141,188 | $22,000 | $119,188 |
| 2016 | $1,458 | $141,188 | $22,000 | $119,188 |
| 2015 | $1,494 | $142,314 | $22,000 | $120,314 |
| 2014 | $1,417 | $142,314 | $22,000 | $120,314 |
Source: Public Records
Map
Nearby Homes
- 2636 Scattered Oak Ct
- 3113 Henslowe Dr
- 2607 Sterling Park Dr
- 2816 Alder Ridge Ln
- 2220 Hoot Owl Ct
- 2271 Trailwood Valley Cir
- 2901 Alder Ridge Ln
- 2221 Mountain Mist Ct Unit 201
- 2208 Sierra Dr
- 2505 Ferndown Ct
- 2228 Trailwood Valley Cir
- 2528 Beech Gap Ct
- 2801 Henslowe Dr
- 1901 Trailwood Heights Ln Unit 304
- 2524 Ferndown Ct
- 2005 Shenandoah Rd
- 2621 Ivory Run Way Unit 105
- 2108 Leadenhall Way
- 2028 Lost Ln
- 2831 Barrymore St Unit 107
- 2609 Broad Oaks Place
- 2613 Broad Oaks Place
- 2607 Broad Oaks Place Unit 35
- 2605 Broad Oaks Place Unit 36
- 2603 Broad Oaks Place Unit 37
- 2619 Broad Oaks Place
- 2545 Lineberry Dr
- 2621 Broad Oaks Place Unit 29
- 2601 Broad Oaks Place Unit 38
- 3345 Joanne Dr
- 3345 Jo Anne Dr
- 2625 Broad Oaks Place
- 2627 Broad Oaks Place
- 2535 Lineberry Dr
- 2148 Ramsgate St
- 3324 Jo Anne Dr
- 2631 Broad Oaks Place Unit 25
- 3341 Joanne Dr
- 3341 Jo Anne Dr
- 2633 Broad Oaks Place